Network Usage Monitoring
I am excited to announce a significant enhancement to Spider: the introduction of Network Usage Monitoring 💪
This new feature empowers users with comprehensive insights into network communications within their Kubernetes clusters, facilitating system discovery, performance optimization, and anomaly detection.
What is Network Usage monitoring?
Network Usage Monitoring provides an aggregated view of all network communications occurring within your Kubernetes environment.
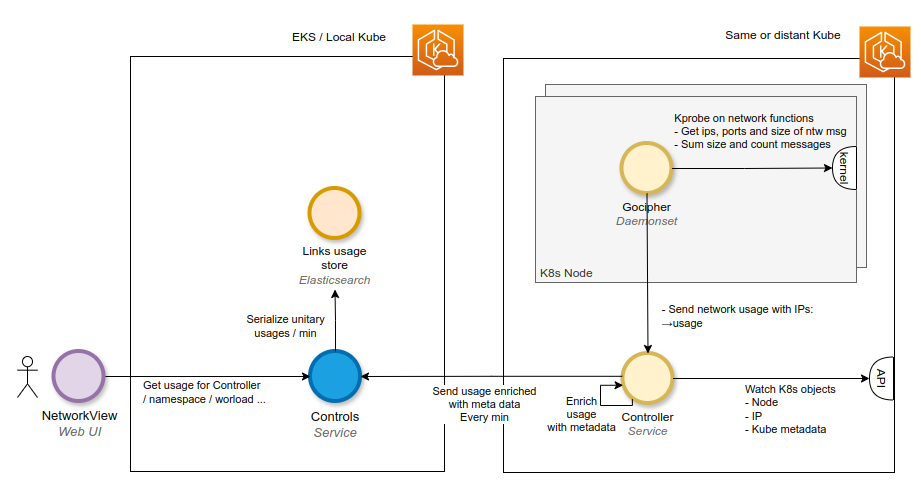
- By leveraging eBPF technology, Spider's Gocipher agents trace TCP and UDP network requests directly within the Linux kernel.
- These agents capture metrics such as the volume of bytes and the number of messages exchanged between IP addresses over one-minute intervals.
- This data is then enriched with Kubernetes metadata by the Controller agents, offering a clear and detailed representation of your cluster's network activity.
This process enables Spider to present a dynamic map of all communications occurring within your Kubernetes cluster over time:
While the data is aggregated per minute to manage volume, it offers a valuable overview for system discovery and anomaly detection.
For instance, you may:
- easily identify workloads that are excessively utilizing DNS queries,
- or detect unauthorized inter-namespace communications!
Key benefits
- System Discovery: Gain a holistic view of how workloads interact within your cluster, identifying communication patterns across namespaces and workloads.
- Anomaly Detection: Spot unusual communication behaviors, such as unexpected inter-service traffic or excessive external communications, which could indicate misconfigurations or security issues.
- Performance Optimization: Identify workloads with high network usage, enabling targeted optimizations to enhance overall system performance.
Network Usage features
The Network Usage views are fully integrated into the Spider experience, bringing all the flexibility and power you expect from your UI:
- Timeline Navigation
- Dynamic Map & Dashboard Top Panels
- Grid & Stats Bottom Panels
- Advanced Filters & Saved Queries
- Progressive Data Loading
- Workload Details
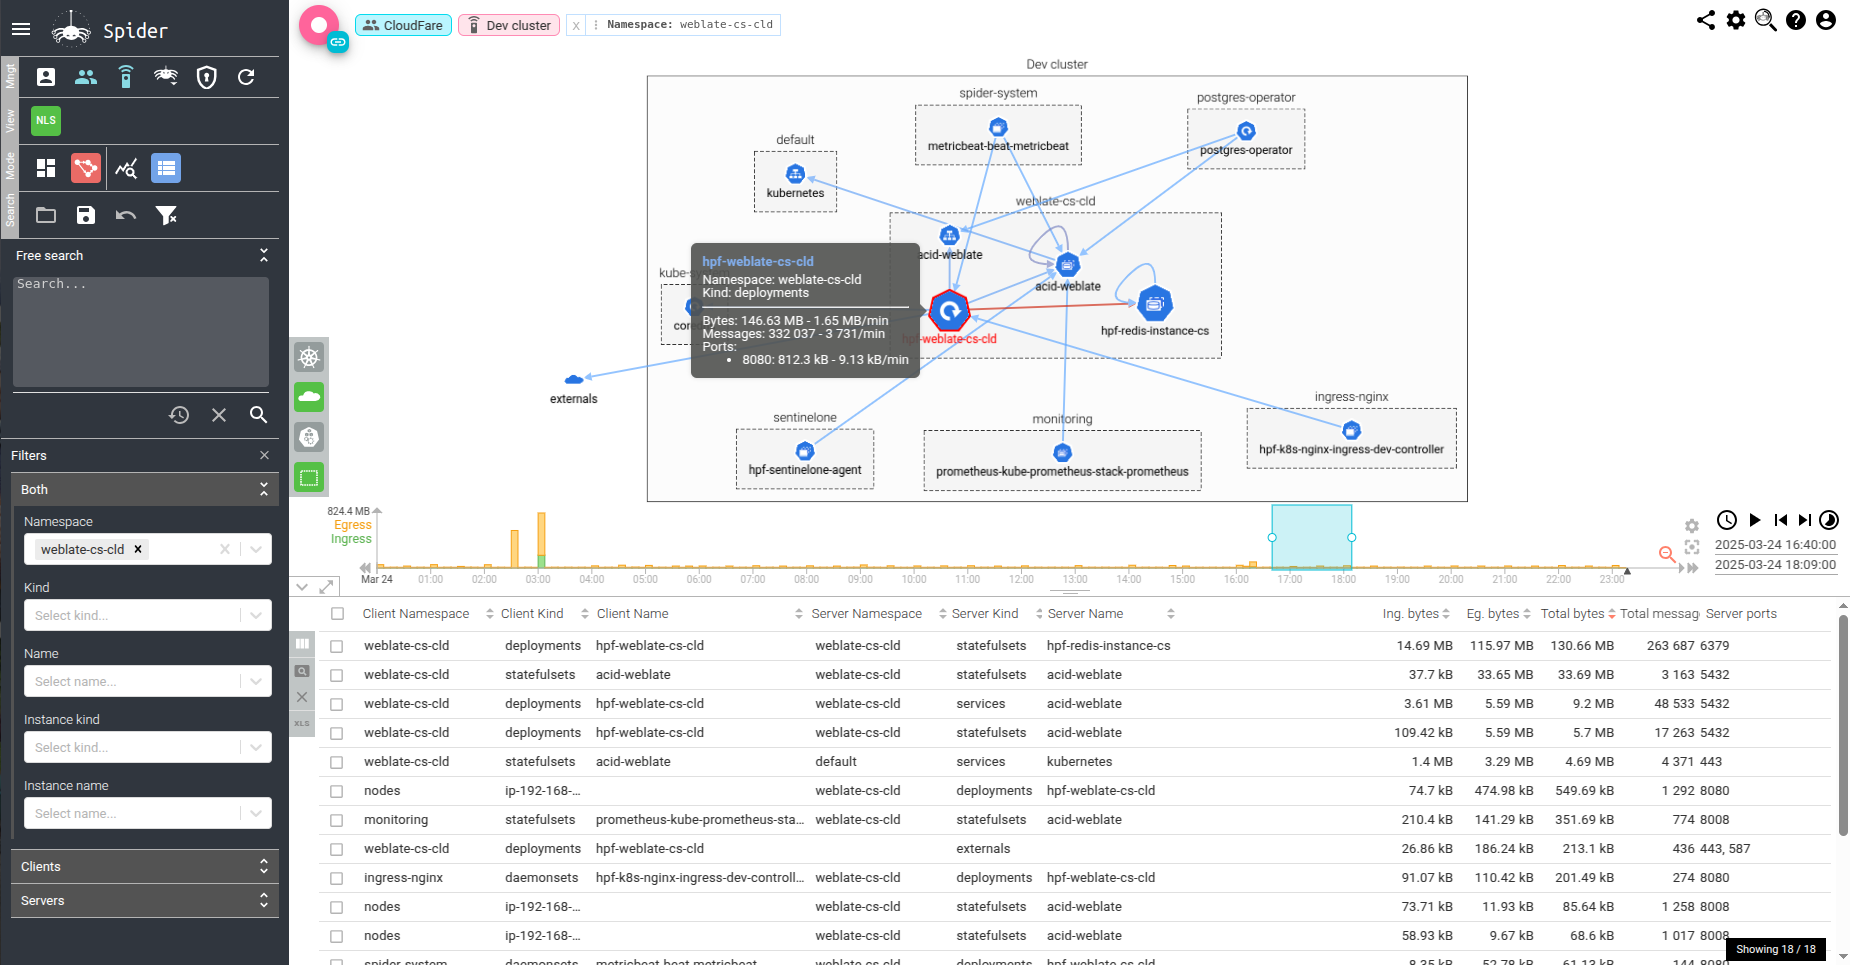
To better represent the complexity of Kubernetes topologies, I've introduced a brand-new interactive network map, built using Cytoscape.js with the fCoSE compound layout.
This new visualization groups workloads by logical units such as nodes and namespaces, giving you a clean, compound-based view of how components communicate inside your cluster.
Whether you're tracking down noisy neighbors, validating service mesh behaviors, or just getting familiar with your system’s traffic flow, this new view makes it easier than ever to understand what's really going on under the hood.
How to access Network Usage data
- Select a Controller: In the Spider UI, choose the Controller associated with your Kubernetes cluster. The Controller acts as the bridge between the Gocipher agents and the Spider backend, facilitating data collection and enrichment.
- Explore the Cluster Map: Upon selecting a Controller, the cluster map visualizes the network usage data. This map provides insights into the logical (LOG) and physical (PHY) arrangements of your workloads and nodes, displaying how different components communicate within the cluster.
- Drill Down into Communications: Utilize the UI to filter and analyze specific communications, examining metrics like byte transfer volumes and message counts between workloads. This granularity aids in pinpointing areas of interest or concern.
Logical view
Physical view
From Observation to Action
Beyond passive observation, Spider enables proactive management:
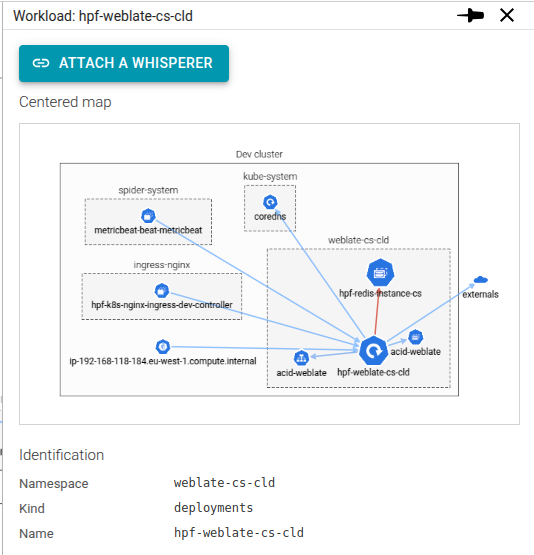
Attach Whisperers to Workloads: After identifying areas of interest or concern within the Network Usage map, you can deploy Whisperer agents to specific workloads. These agents perform detailed network captures, providing granular data for in-depth analysis.
This process can be initiated directly from the workload's detail view within the UI, enabling targeted analysis of network traffic for particular applications or services.
Learn More
For detailed guidance on utilizing the Network Usage feature, please refer to the documentation: