Monitoring - Servers status dashboard
· 3 min read
Description
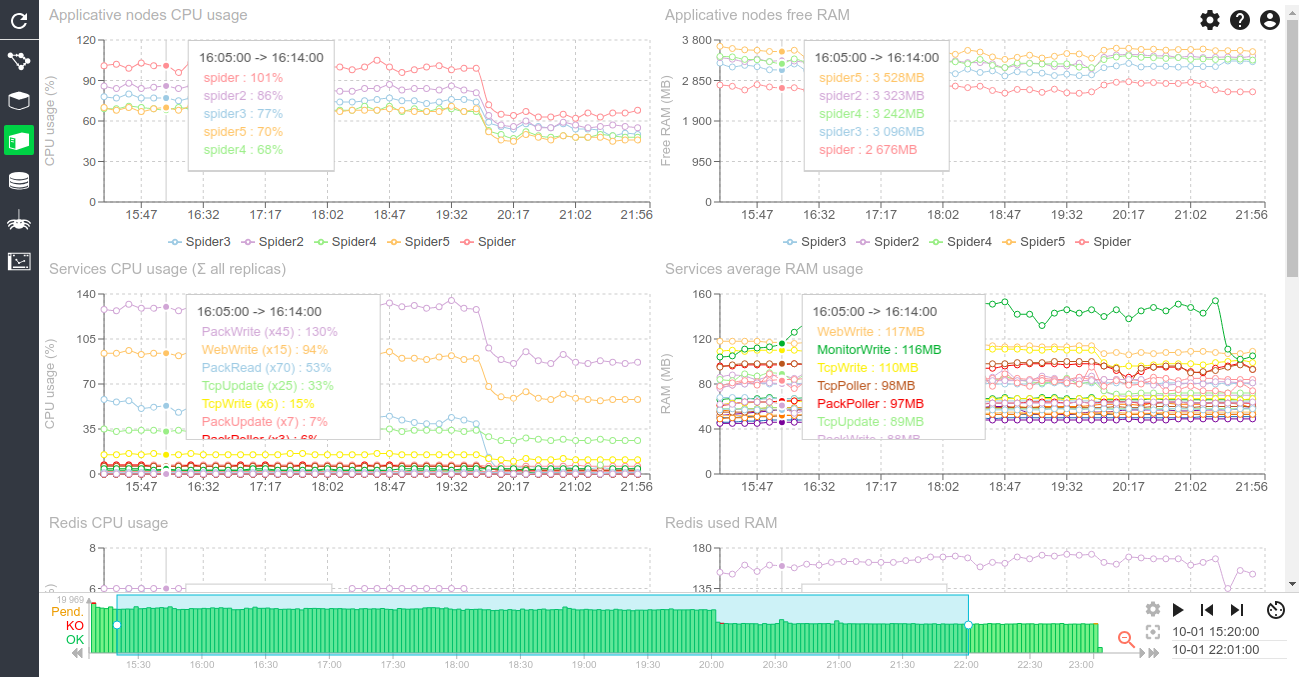
This dashboard provides a status of the servers hosting the cluster and its datastores: CPU, RAM…
Screenshot
Content
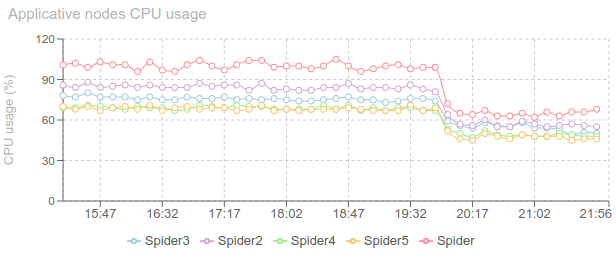
Applicative nodes CPU usage (chart)
- CPU usage of each node involved in the applicative cluster
- Can be above 100% when multiple cores
- Stability is key
- Same usage on each nodes is preferred
- Target is below 75% * number of cores
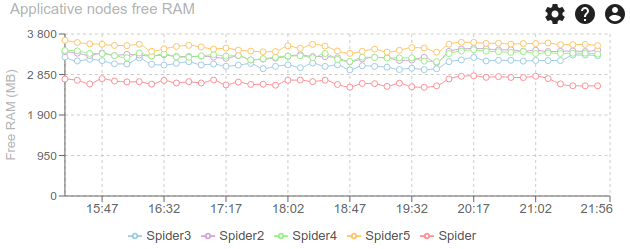
Applicative nodes free RAM (chart)
- Free RAM usage of each node involved in the applicative cluster
- This include the caching, so could be rather low
- Stability is better
- Same usage on each nodes is preferred
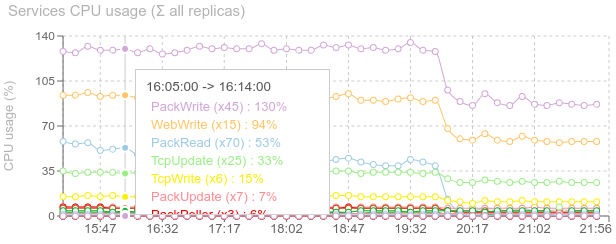
Services CPU usage (chart)
- Sum of all CPU usage of all replicas for each service
- Allow to find most demanding services easily and scale them
- Allow to track weird behaviors
- We can see that the most used ones are:
- PackWrite that receives and parse Packets from Whisperers
- WebWrite that aggregates packets of a TCP session to parse it
- PackRead that gives packets to Webwrite
- TcpUpdate that updates TCP sessions
- TcpWrite that receives TCP sessions from Whisperers
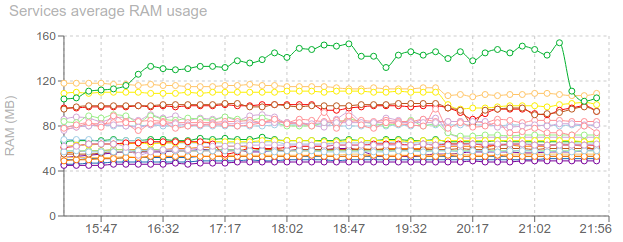
Services average RAM usage (chart)
- Track the average RAM usage of all replicas for each service
- Stability is the target
- There is currently an issue with MonitorWrite memory. Yet to be fixed.
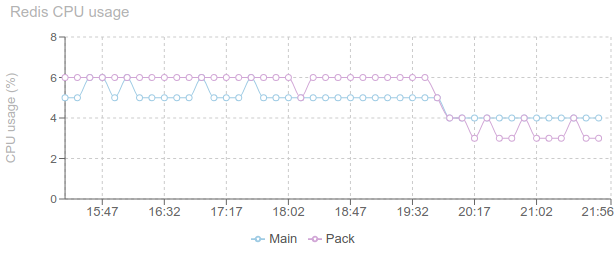
Redis CPU usage (chart)
- Track the CPU usage of Redis databases instances
- Nothing special to say... it is so small!
- The number of instances and what they hosts is configurable
- Here:
- Main: Tcp sessions, Http coms and Http pers
- Pack: Packets, Status, Whisp status, Customers and Whisperers
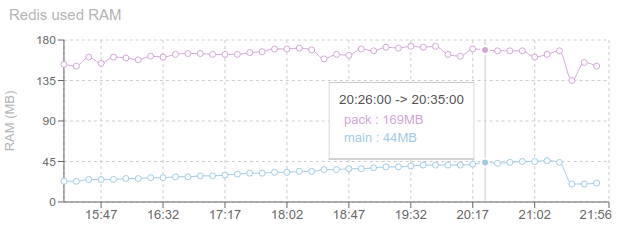
Redis used RAM (chart)
- Tracks the memory usage of Redis
- When the processing of pollers and parsing is too slow, Redis accumulates data and can reach its maximum (1GB for default)
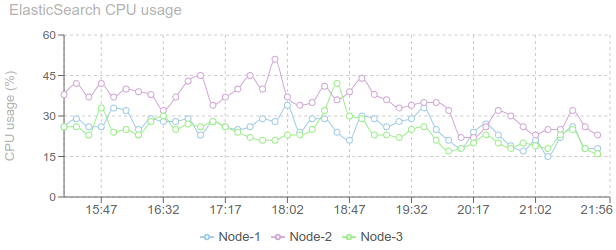
Elasticsearch CPU usage (chart)
- Tracks the CPU usage of Elasticsearch inside each Node of Elasticsearch cluster
- Maximum at 100%
- Stability is a key
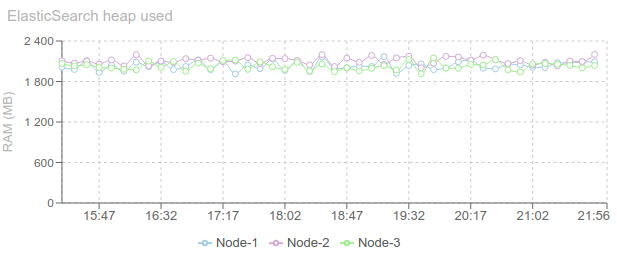
Elasticsearch heap used (chart)
- Track the JVM Heap used of Elasticsearch on each node
- Should stay below the limit (each: 4GB - half the node memory)
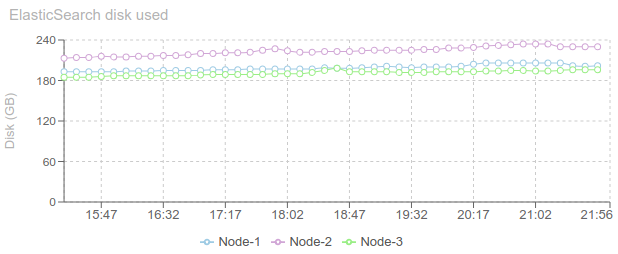
Elasticsearch disk used (chart)
- Track the disk used on each ES node
- Should not reach the limit (here, 400 GB)
