Monitoring - Whisperers status dashboard
· 5 min read
Description
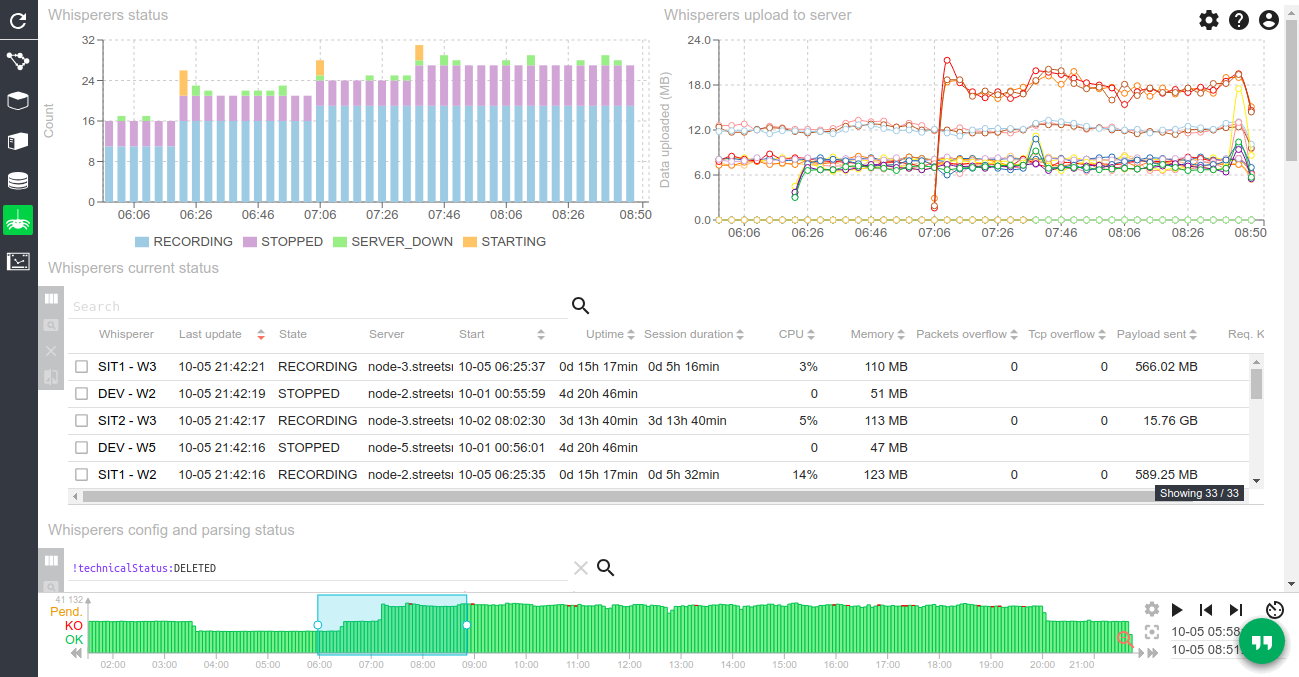
This dashboard provides a status of Whisperers clients: state, uploaded data, quality of parsing, cpu, ram, queues, circuit breakers…
Screenshot
Content
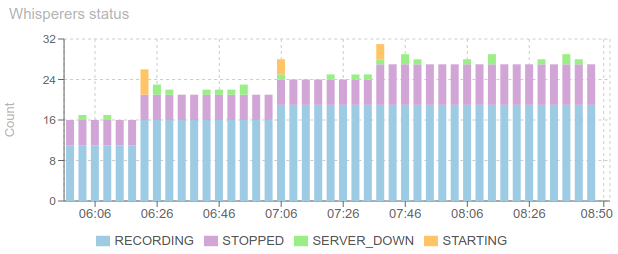
Whisperer status (chart)
- Tracks status of all Whisperers connected to the server:
- Starting
- Recording
- Stopped
- Invalid_Config
- Internal_Error
- Server_Down (when they can't get configuration)
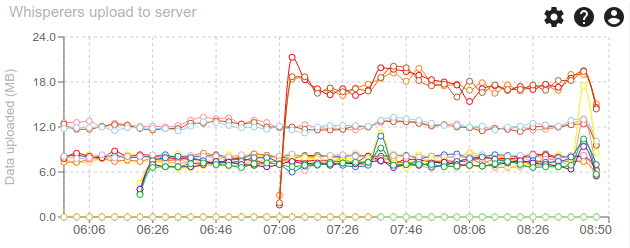
Whisperer uploads to server (chart)
- Tracks data uploaded from the Whisperer to the server, in MB
Whisperers current status (grid)
- Lists current session status sent by all Whisperers
- Whisperer start, host monitored and uptime
- Session start and duration
- CPU, RAM
- Payload sent and errors
- Common Spider features on grid:
- Allows opening the status record in the detail panel
- Allows comparing items
- Full integrated search using ES querystring with autocompletion and color syntaxing
- Many fields to display / hide
- Sorting on columns
- Infinite scroll
Whisperers config and parsing status (grid)
- Lists Whisperers and their parsing status over the selected period
- Sent sessions, amount and percentage of parsing errors
- Parsed Http communications and missing part
- Common Spider features on grid:
- Allows comparing items (config and stats merged)
- Full integrated search using ES querystring with autocompletion and color syntaxing
- Only on Whisperer config
- Many fields to display / hide
- Sorting on columns (from config)
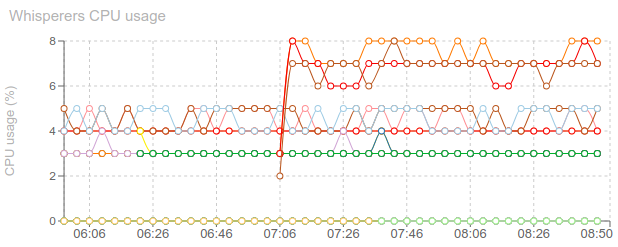
Whisperer CPU usage (chart)
- Tracks status CPU usage of all connected Whisperers
- Should be low ;)
- The more packets captured and parsed, the more CPU usage.
- Captured packets can be limited by PCAP filter
- Parsed packets can be limited by Hostname blacklisting in configuration
- A circuit breaker on CPU usage can be set to pause Whisperers when too high load
- Classic usage: between 3 and 10%
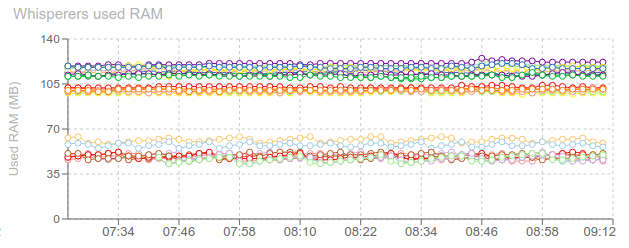
Whisperer used RAM (chart)
- Tracks status RAM usage of all connected Whisperers
- Classic usage:
- 115 MB when capturing and server responding
- 50 MB when stopped
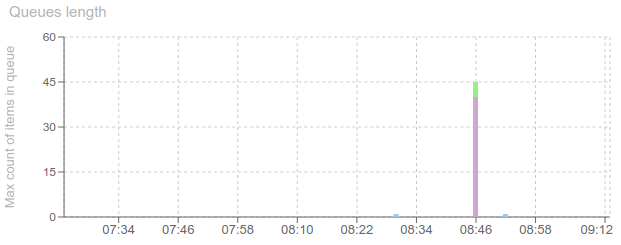
Whisperer queue length (chart)
- Tracks size of sending queue of Whisperers
- Packets and Tcpsessions
- When a Whisperer has too many requests to send to server, they are pushed to a queue, waiting for next slot to be sent.
- When items are in the queue, it means either:
- The server is getting slow and has issues
- The Whisperer is under high pressure of packets to capture
Queues overflow (chart)
- Tracks size of queues overflow
- Packets and Tcpsessions
- When a Whisperer has too many requests to send to server, they are pushed to a queue, waiting for next slot to be sent.
- When the queue is full, oldest items in queues are discarded and never sent.
- This causes parsing issues and missing data (not sent)
- It shouldn't happen if the Whisperers and Servers are correctly scaled ;)
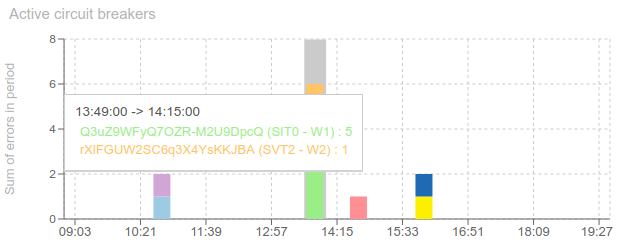
Active circuit breakers (chart)
- Tracks when Whisperers have active circuit breakers
- When a Whisperer cannot connect to the server, or fails sending data (time out, mostly), a circuit breaker opens, and the Whisperer stops trying for some time.
- Data is lost
- This can happen when:
- CPU on the host the Whisperer is in is heavy loaded
- Server is not scaled big enough
- Server is partially down
- When server is completely down, the Whisperer stops its capture and waits for it to get back up again
Whisperers status items (grid)
- Lists all status sent by Whisperers
- Items are pre filtered on those having errors
- Common Spider features on grid:
- Allows opening the status record in the detail panel
- Allows comparing items
- Full integrated search using ES querystring with autocompletion and color syntaxing
- Many fields to display / hide
- Sorting on columns
- Infinite scroll
Hosts items (grid)
- Lists hosts resources of Whisperers
- Hosts resources tracks the name resolving of Hosts seen by Whisperers
- Start and stop of capture for each host
- Dns names
- Custom names set by users on UI or by parsing configuration
- Position on map (if fixed)
- An host resource is updated at regular interval, and a new one is created only when an host changes IP or Dns name
- Common Spider features on grid
- Allows opening the host record in the detail panel
- Allows comparing items
- Full integrated search using ES querystring with autocompletion and color syntaxing
- Many fields to display / hide
- Sorting on columns
- Infinite scroll
Hosts stats (grid)
- Perform statistic on Hosts resources for each Whisperer over the period
- If, over a couple of hours, a Whisperer has too many Hosts records, with a very short average duration, it means that:
- Names of hosts is not stable
- For instance Docker Swarm has a bug in reverse DNS of hosts. Often, the id of the Docker is returned instead of the name of the service replica.
- This can be worked around with Whisperers settings
- Name resolving of IPs on the UI may fail
- The UI limit its load to 99 Hosts resources at once.
- Names of hosts is not stable
- Grid has limited features: only display.
