UX Improvements
A new set of UX improvements have been deployed of the last month and are part of next coming release.
New Content-Length columns in HTTP grid
When troubleshooting an issue on production, we took more time than necessary because the Response Size column - which is indicating the captured size of the payload - lead us in error.
Indeed, the issue we were troubleshooting was due to large payload generated by the services (10 MB every 20s!) but went unseen.
To avoid such mistake again, I added the content-length HTTP header value for both request and response,
- In the grid
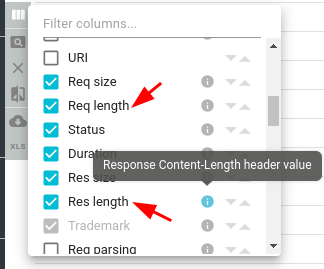
- In the filters in the menu

You may now filter on it, and sort on it as well.
Request and response size are relevant still, since you may not always have the header present!
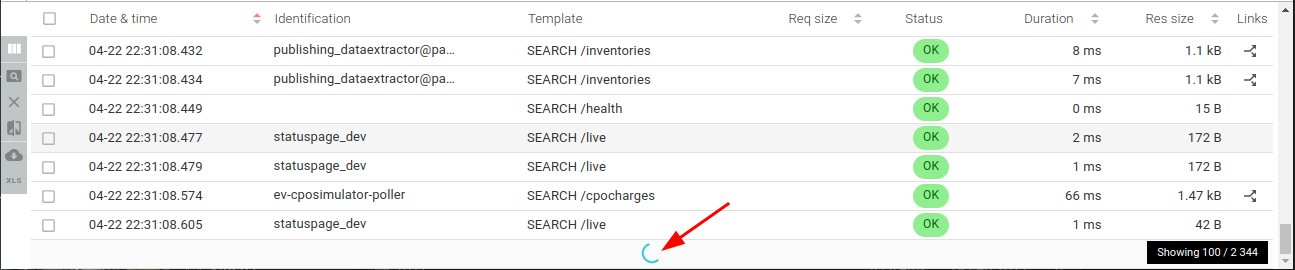
New loaders
When Spider is working with a lot of data (3 TB currently!), it can take more than 10s to answer some stats selection. To enhance the UX, I added a few loaders / spinners:
- When you are scrolling down (infinite scroll)
- the sequence diagram
- the grid
- For each statistic diagram on the stats panel
- For the pivot table on the stats panel

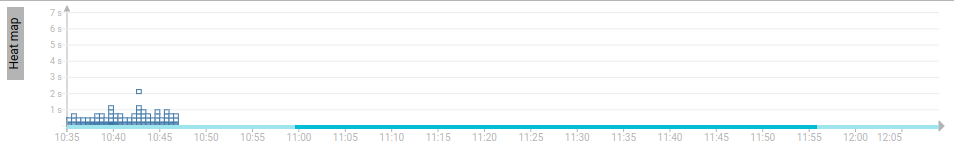
Also:
- Heatmap diagrams are now loading with paginated aggregation, thus loading progressively. They will never time out any more.
- Pivot tables are now loaded with asynchronous querying, which I used before implementing paginated queries on timeline and map.
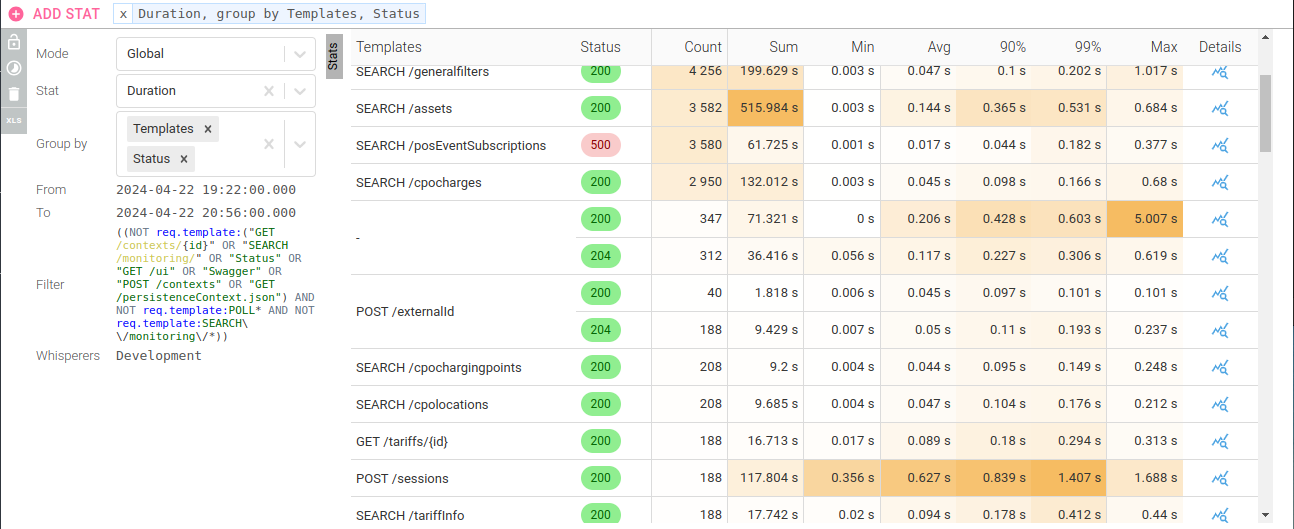
Sticky header and scroll area for Pivot tables
Pivot tables on stats panel may load hundreds of lines.
When scrolling, you were losing the header line, and the action icons.
I changed this, to do as for the grid:
- It now has a sticky header
- And a scroll area which takes, as most, the height of the current bottom panel
Test it, it's much better! 😍
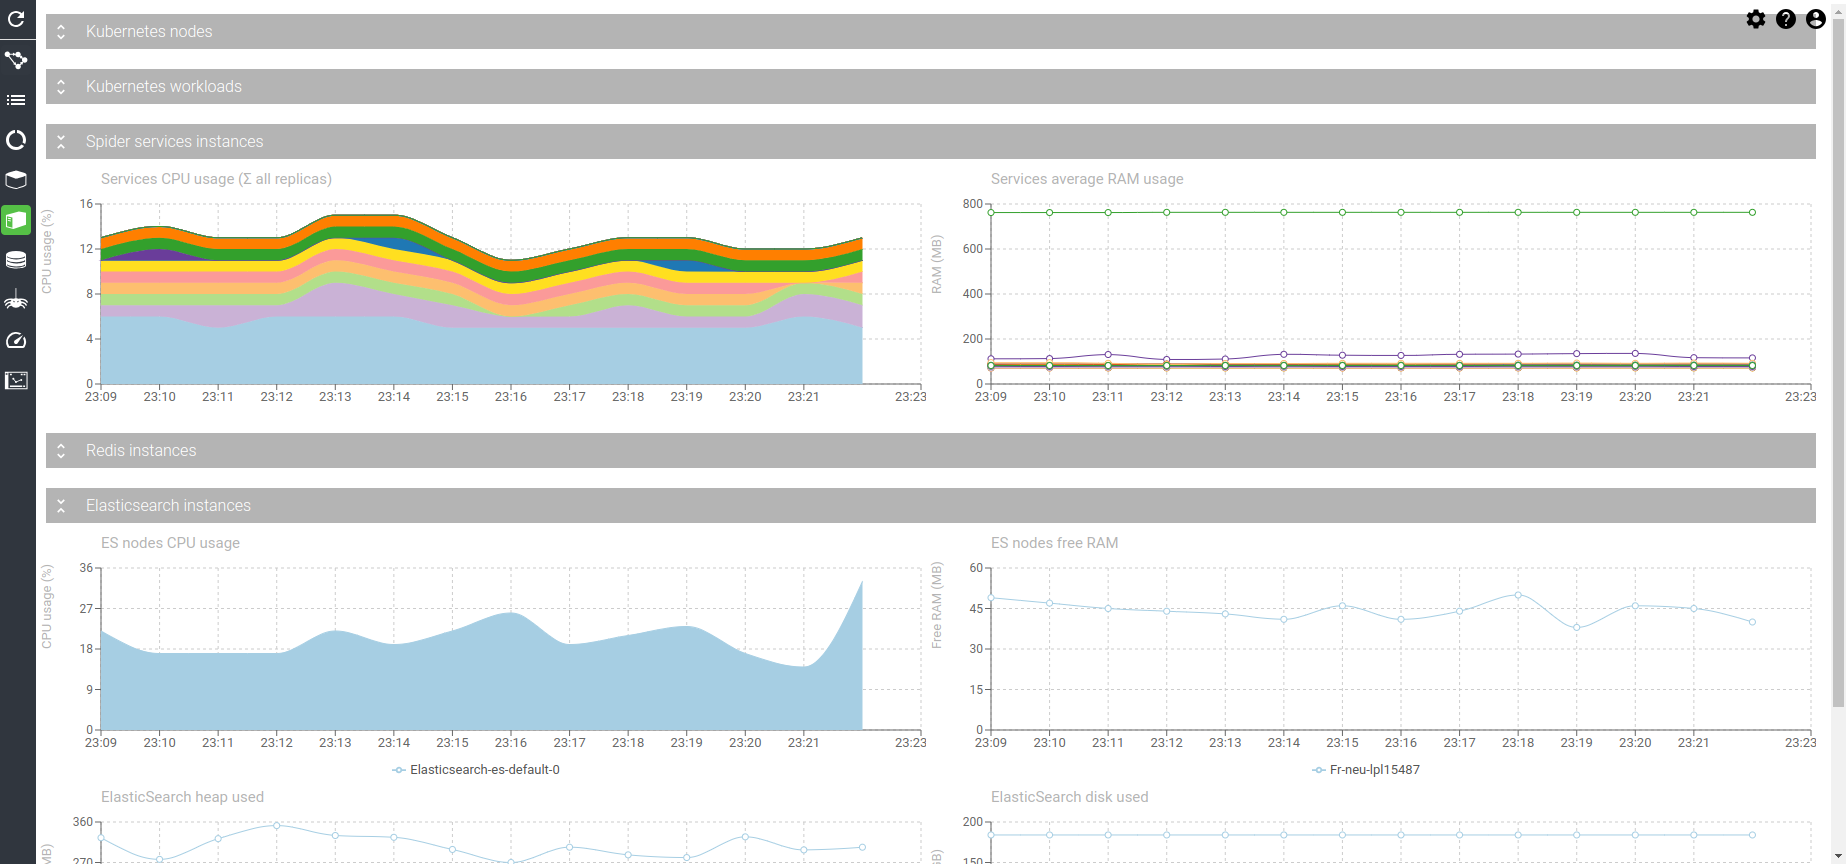
Sections in Monitoring UI
I took the opportunity that I was adding 2 new charts for Data Storage Policies monitoring to implement 'sections' in the monitoring UI.
Now charts and tables are regrouped in section, that you may fold or unfold to focus on specific charts.
And the charts that are hidden are not generating queries on refresh ! 😀 Thus saving time, resources and CO2. 💪
The most fun was to do it completely in a generic way with props injection in children nodes in React. Nice 😀