New tool to save HTTP stats
Spider may be very useful to extract system statistics.
But its small retention time (due to high data volume) limits the usage you may do with these stats.
This new tool extracts HTTP statistics from Spider captured data and save them into another index with longer retention time.
The tool:
- is deployed as a Docker, may be executed in a crontab as as a Kubernetes job
- takes as parameters (among others):
- the relative period to extract stats from,
- the grouping axes,
- the field on which to compute stats,
- any filter to customize source data
Dashboard
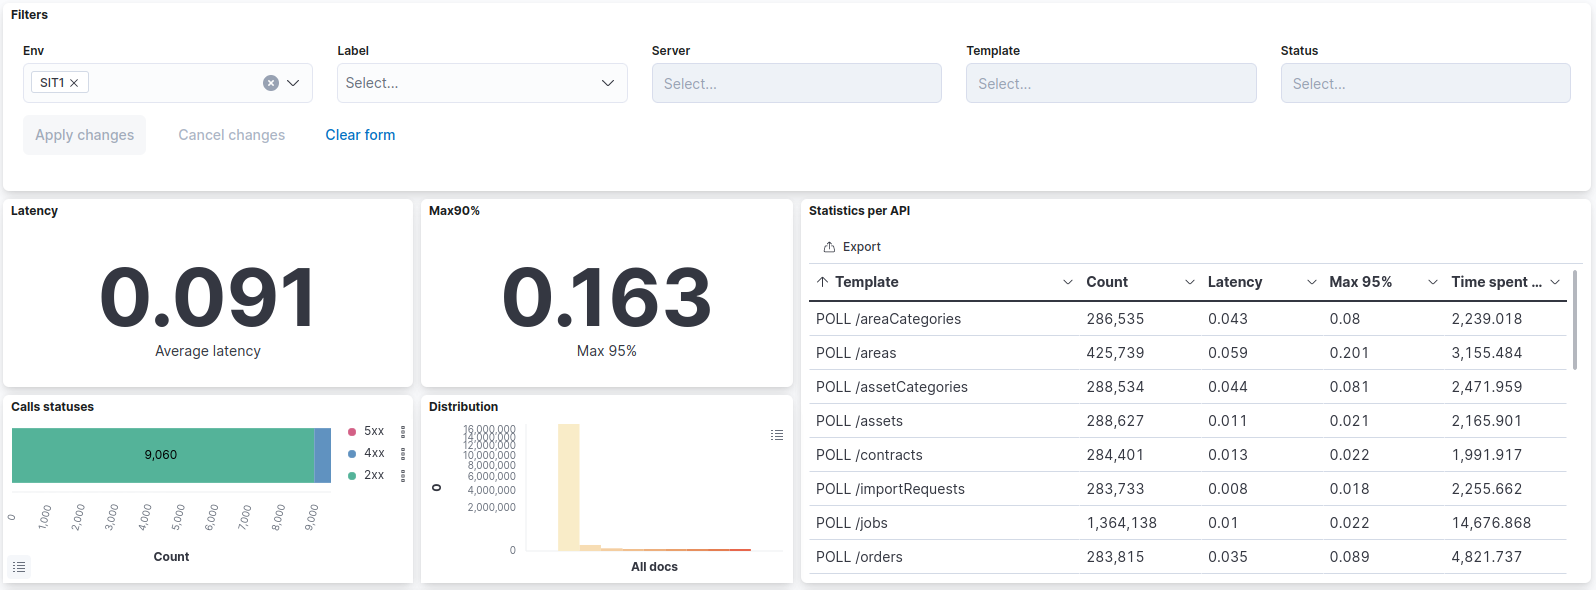
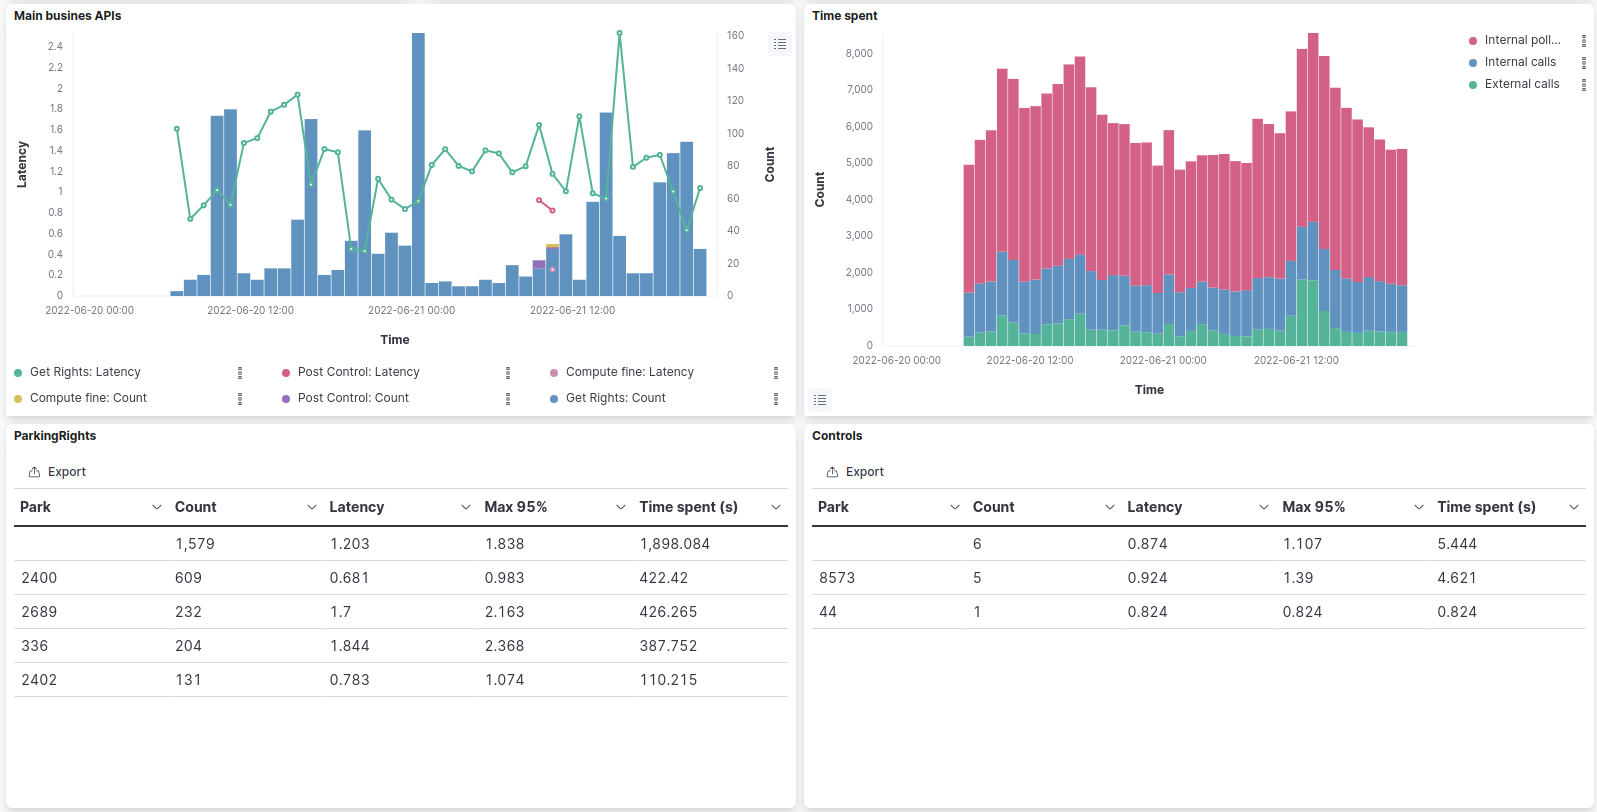
I designed a first dashboard in Kibana (but could be done in Grafana) as an example:


The dashboard can be filtered by service, api, status and external/internal requests.
Configuration
Example:
{
  "statsPeriod": {
    "start": "now/h-1h",
    "end": "now/h"
  },
  "whisperer": "",
  "spiderEsNode": "http://...",
  "monitoringEsNode": "http://...",
  "env": "...",
  "innerClusterNetwork": "10.1.0.0/24",
  "stats": [
    {
      "label": "External requests",
      "groups": [
        { "label":  "server", "field": "stats.dst.name" },
        { "label":  "template", "field": "req.template" },
        { "label":  "status", "field": "stats.statusCode" }
      ],
      "statField": "stats.duration",
      "limitTo": "EXTERNALS"
    },
    {
      "label": "Internal requests",
      "groups": [
        { "label":  "server", "field": "stats.dst.name" },
        { "label":  "template", "field": "req.template" },
        { "label":  "status", "field": "stats.statusCode" }
      ],
      "statField": "stats.duration",
      "limitTo": "INTERNALS"
    },
    {
      "label": "Controls by Park",
      "groups": [
        { "label":  "server", "field": "stats.dst.name" },
        { "label":  "template", "field": "req.template" },
        { "label":  "status", "field": "stats.statusCode" },
        { "label":  "park", "field": "stats.tags.park" }
      ],
      "statField": "stats.duration",
      "limitTo": "EXTERNALS",
      "filter": "req.template:\"POST /controls\""
    }
  ]
}
Source
- spiderEsNode: Spider ES server where the data is
- whisperer: Id of the whisperer capturing the data to export
- env: Label of the environment (used in the exported stat structure)
- innerClusterNetwork: Network used in the system under capture
  "whisperer": "u1BHa8ZlT8GP8qPGQDkqRw",
  "spiderEsNode": "https://user:pass@node:port",
  "env": "SIT1",
  "innerClusterNetwork": "10.1.0.0/24",
Destination
- monitoringEsNode : Target Elasticsearch node
"monitoringEsNode": "https://user:pass@node:port"
Period
Define the relative period to extract the stats from:
 "statsPeriod": {
    "start": "now/h-1h",
    "end": "now/h"
  }
Stats
List of stats to export:
- label: Tag the extracted stats
- groups: Define the grouping fields for the stats, with their label in the extracted stats
- statField: On what field stats are computed
- limitTo: Adds a filter, when present to limit stats on
EXTERNALSorINTERNALScalls, based on the defined network in config - filter: Add a custom filter to limit stats to... whatever
Output
An extracted stat looks like this, in the target index:
{
  "env" : "SIT1",
  "label" : "External requests",
  "start" : "2022-06-19T20:00:00.077Z",
  "stop" : "2022-06-19T20:59:59.821Z",
  "timespan" : {
    "gte" : "2022-06-19T20:00:00.077Z",
    "lte" : "2022-06-19T20:59:59.821Z"
  },
  "group" : {
    "server" : "businesscustomer_parks_service",
    "template" : "SEARCH /areas",
    "status" : 200
  },
  "stats" : {
    "count" : 9,
    "min" : 0.046460999999999995,
    "max" : 0.356437,
    "avg" : 0.17882433333333334,
    "sum" : 1.609419,
    "stddev" : 0.09696893834740185
  },
  "percentiles" : {
    "50" : 0.18603499999999998,
    "90" : 0.32588659999999997,
    "95" : 0.356437,
    "99" : 0.356437
  },
  "distribution" : {
    "0" : 7,
    "250" : 2
  }
}
- start, stop, and timespan: Period of the stat, timespan being a date range for easier queries
- group: values of the group
- stats: simple stats
- percentiles: most meaningful percentiles
- distribution: distribution histogram of the calls, per 250ms steps
Packaging
The tool is distributed as a docker image: registry.gitlab.com/spider-analyzer/images/save-http-stats
Running
Initialisation
Initialisation creates the output index specified in the config.json
docker run \
 -v [path to config]:/app/config.json \
 --network host \
 --rm \
 registry.gitlab.com/spider-analyzer/images/save-http-stats \
 init
This scripts creates:
- An ILM
spider-http-stats-ilmto rule the indices lifecycle and storage- Roll over every week + search optimisation
- Deletion after 1 year
- An index template
spider-http-stats - An alias
spider-search-http-statsto use to search the stats- It will allow searching on all stats indices
- A first index
spider-http-stats-...- With the date of today
- With the alias
spider-active-http-stats
The active alias is used to index in the extract script.
A new index is created automatically every week to store new extracted data.
Extracting stats
Command to run the script
docker run \
 -v [path to config]:/app/config.json \
 --network host \
 --name save-http-stats \
 --rm \
 --restart no \
 registry.gitlab.com/spider-analyzer/images/save-http-stats
Best is to add this in a small shell script, and add it to cron.
Every [scheduled] time, the script will run and extract the programmed stats from the related time.