Whisperer have seen a huge improvement over the past weeks:
- They can be remotely started and stopped from the services or the GUI
- They monitor their configuration changes and their configuration can be updated on the GUI
- They send the available interfaces on their hosts for configuration
- They monitor their process and allows health checking and monitoring on the server side
- First monitoring features have been included in the GUI
Whisperer have now 3 distinct modes:
- INTERFACE: They are remote whisperers, installed on a host, that capture network traffic in real time
- UPLOAD: They are whisperers dedicated to pcap uploading in Spider GUI
- FILE: They are 'tests' whisperers, that can parse a pcap file on a host and send the file to Spider.
The GUI displays the status of an 'INTERFACE' whisperer in the top left corner


In the order:
- Not visible: Whisperer is not started, or not communicating
- Connecting: Whisperer is starting
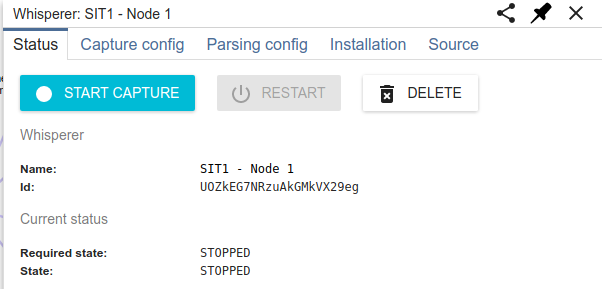
- Stopped: Whisperer is started, available, but not capturing
- Capturing: Whisperer is capturing data
- Wrong configuration: Whisperer configuration is not correct
The control of Whisperer status is made on the Whisperer detail view with the button to START/STOP CAPTURE.

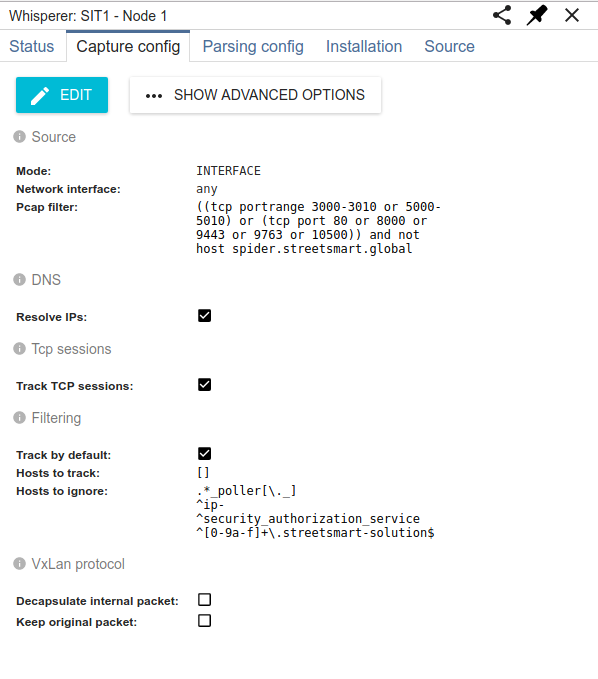
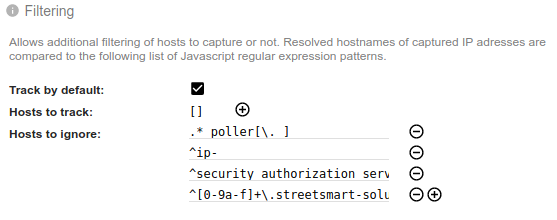
 Whisperer configurations can now be changed on the GUI.
The Capture Config tab sets configuration on the Whisperer sniffing agent, and the Parsing Config tab sets the configuration for the parsing on the server.

- Help is given by clicking on the small (i) icon
- Valid network interfaces on the Whisperer side are provided for help
- Value correctness is checked (when possible) on the GUI side
A color code is used to display the value status:
- Blue: this is default value, it is not specifically set for the Whisperer and comes from server default
- Orange: modification in progress
- Green: valid change
- Black: value is specifically set for the whisperer
- Red: value is not correct. An help message is provided in tooltip of the error icon.

The status of the Whisperer is send regularly to Spider.
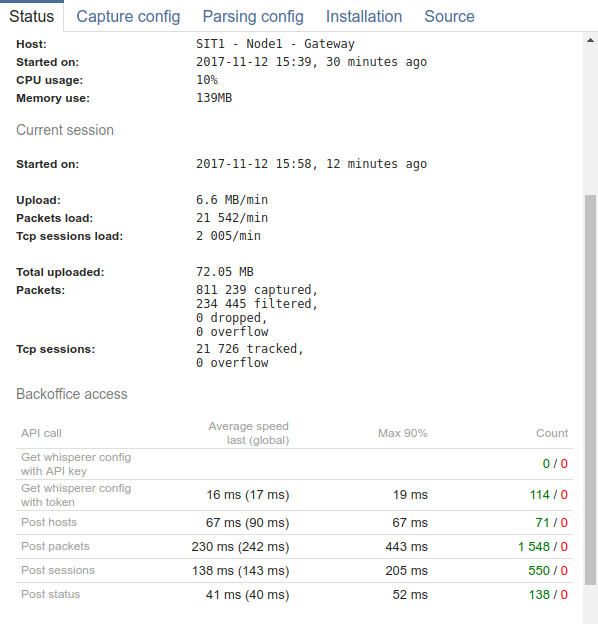
The Whisperer details view first tab shows a summary of information:

- Cpu usage of Whisperer on host, average since last update
- Memory usage, instantaneous
- Time of capture start
- Speed of capture
- Total of uploaded data
- Speed of API calls to back office
- Total of all times for this whisperer

