156 posts tagged with "features"
View All TagsNew Help details
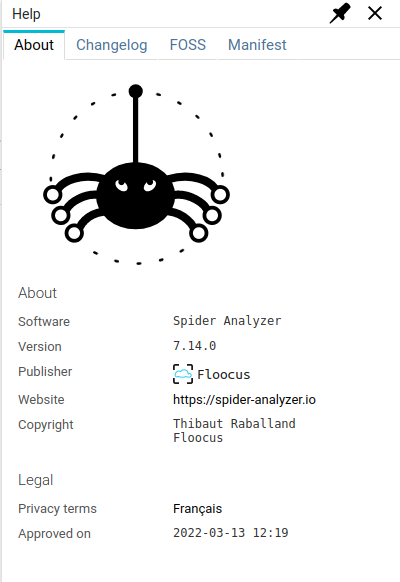
Instead of only redirecting to https://spider-analyzer.io, now the Help page provides more information.
- The classic About terms.
- The Changelog - that moved position from an independent details to here.
- The list of Free and Open Source tools and libraries used with their licences.
- It takes a bit of time to... render ;)
The content is driven by a jsonld public manifest file visible in the Manifest tab.
New alert probe
I just added an alert probe that alerts the administrator when the parsing delay gets over a threshold (default to 30s).
This complements the work done on parsing delay monitoring.
I'm studying now the possibility to add alert status to the monitoring UI, and the parsing delay in monitor-write tooltip. ... for later !
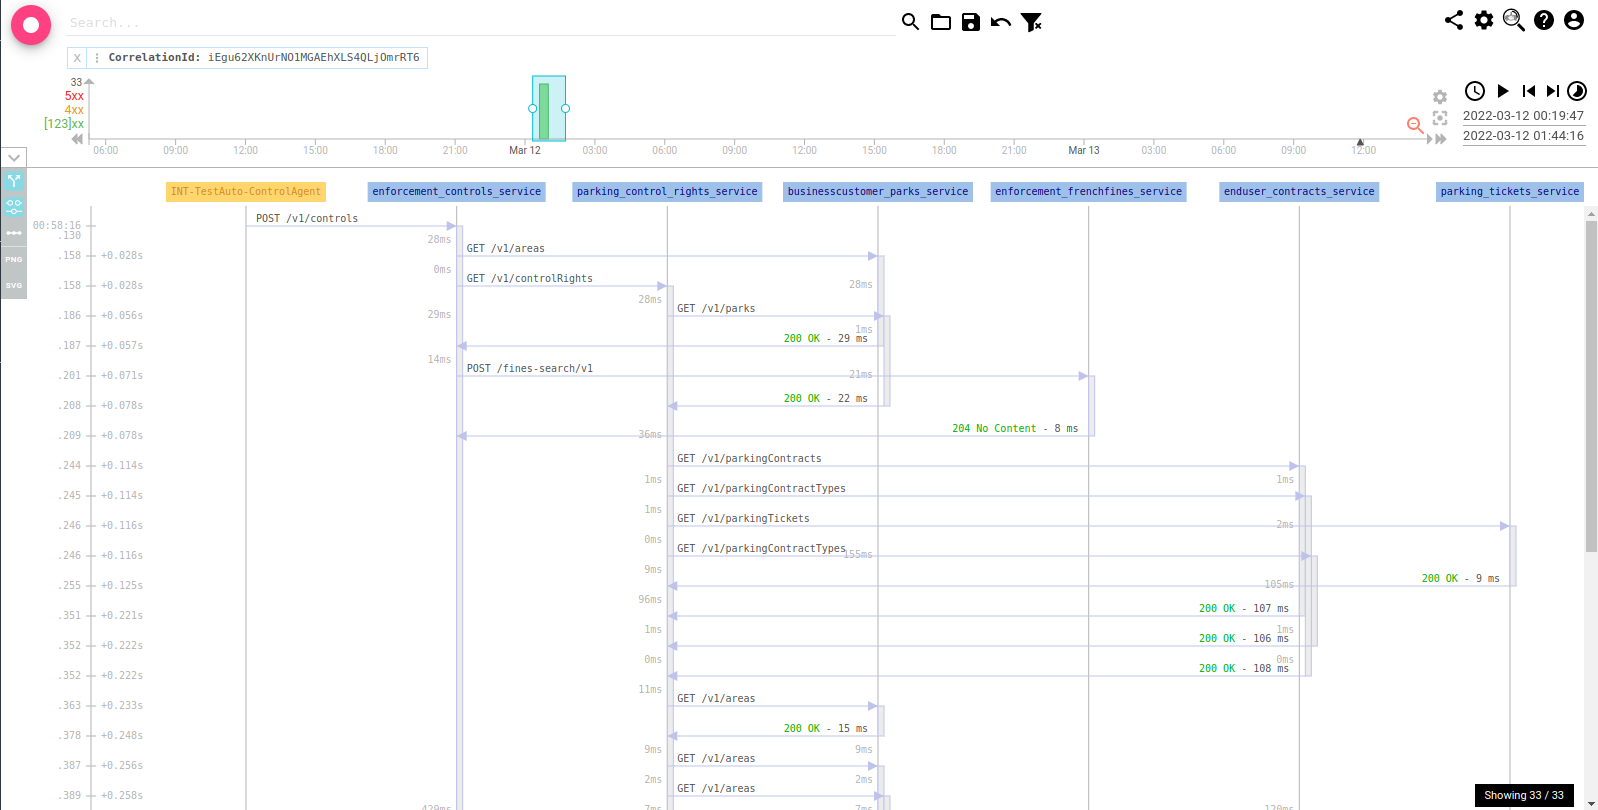
Improved free time selection
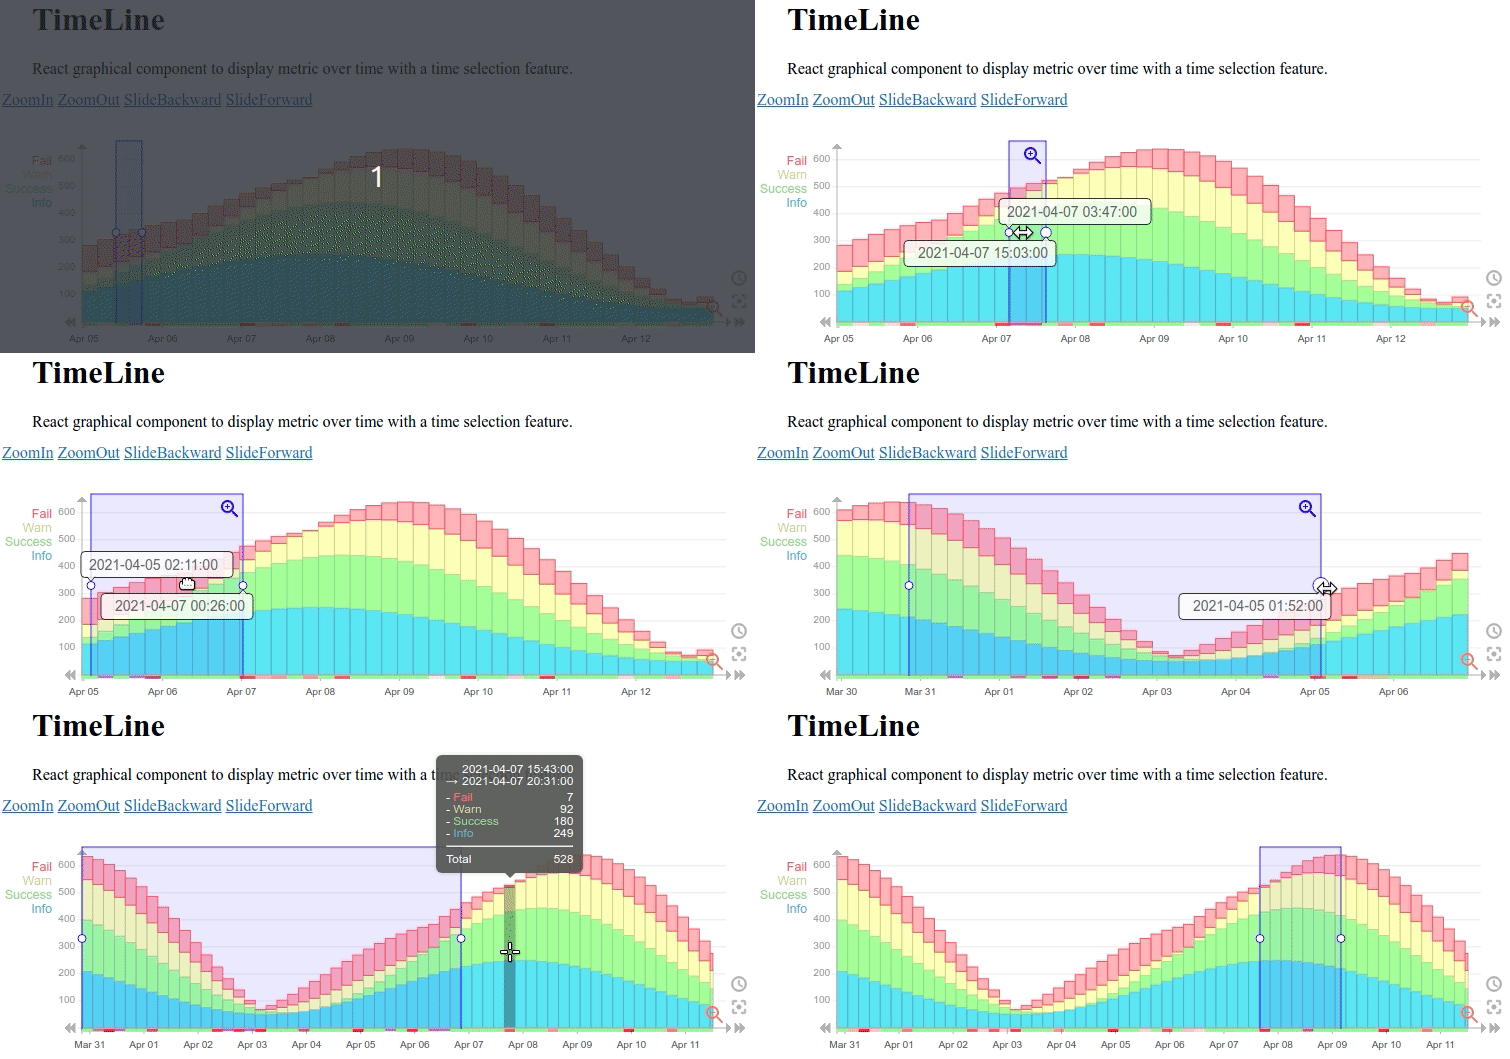
Playing with Spider during non regression with very old pcap captures files, I kept fighting with the free time selection inputs on the right of the timeline.
It was difficult to move to 2018 or such!
I figured out that validation and change acceptance of those inputs needed to be done on both inputs together. So I redesigned the UX there, and it is much better now IMO :)
Tell me what you think!
-
You may validate a change of only one input by pressing enter (when no error)
-
You may validate a change of both input at once with the validation button
- Thus this allows moving far and fast in time by changing both inputs, and validate only when finished.
-
When there is an error, the error text shows up with the possibility to cancel the change.
Enhanced monitoring for parsing status
When playing with chaos testing, I noticed that I had no metric telling me if parsing speed was right, ok close to the limit. I knew when parsing was failing, but not if it was about to fail.
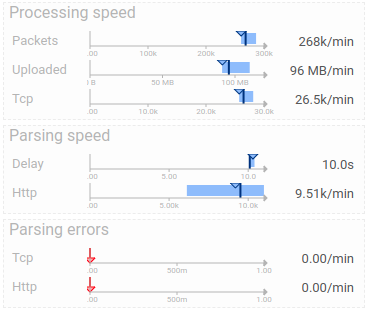
I then designed and added new metrics for parsing speed:
- Delay before parsing
- Duration of parsing
- Speed of parsing
The first KPI indicates if parsing 'power' is enough, as it must stay between 10s (delay before parsing in the configuration) and 45s (TTL of packets in Redis).
The other KPIs indicates speed of parsers with current load and will allow to compare performance improvements.
- I added a new API to expose those metrics: https://spider-analyzer.io/home/api/#/Common/get\_\_parser\_\_v1\_stats\_parsing\_
- And then I enhance monitoring dashboards with them:
In the main dashboard
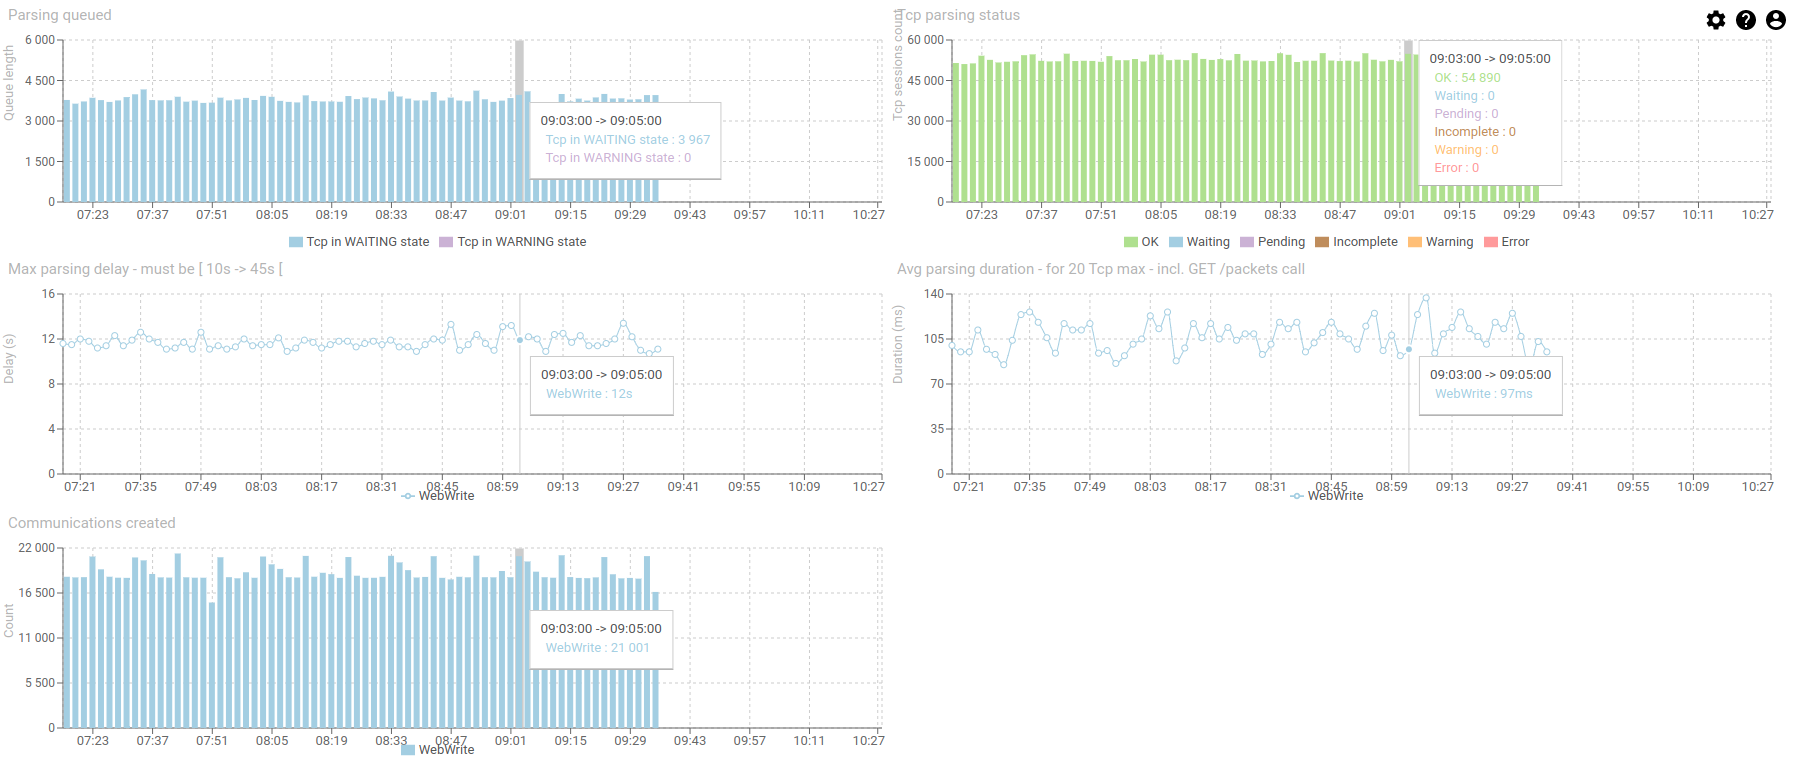
As a new parsing page
I regrouped the previous parsing KPI together:
- Tcp to parse in queue - to check it is not increasing
- Tcp parsing status - to check quality of parsing
- Maximum parsing delay - to check it stays way below 45s
- Parsing duration of a polled page of Tcp sessions (max 20) - to check speed
- Amount of communications created from the parsing - to check we indeed created something :)
All in all... 1 day of work :)
Avoiding duplicates
When capturing both sides of the same communication - for instance, when capturing from both the gateway and the service itself - Spider captures twice the same communication, with sightly different dates.
It is now possible to ask Spider to avoid duplicates.
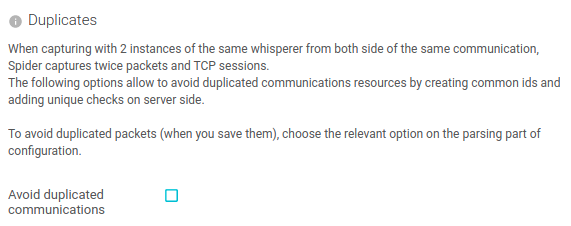
Avoiding duplicated communications
With this option, Spider will generate the same id for the object on both side of the communication, and only one will be then saved (and parsed).
For this, select 'Avoid duplicated communications' on Capture Config tab.
Then, only one Tcp session will be created, and thus, only one example of the Http Communications.
Avoiding duplicated packets
You may also chose to avoid duplicated packets, on the advanced options of the Packets saving part of Parsing Config tab. The options is visible only when saving packets.
Note that this is asking more resources in of the system, and should be only considered when doing statistics at the packet level (not often).
Changelog since may 2021
It's been a while I did not write here.
Spider is progressing, but I spent much of my time Spider doing administrative and legal stuff. It's official public release is approaching :)
I nevertheless did some stuff:
- Upgraded all services and UIs to Node 16 in august and september, with an upgrade of all libraries
- Improved the UI so that it checks for a new version every time it receives the focus. With an integrated changelog of UI versions displayed in the details panel by rendering the service CHANGELOG.md file. You might have seen it already.
- Improved teams configuration to allow copying teams settings to the user's in order to troubleshoot and improve them (the opposite was already existing)
- Import/export of Whisperer configuration (decoding and parsing) from a file. This would have proven useful before, so it will again !
And I've spent some time solving my 'last' parsing issues to support long communications and optimise again the parsing.
That's for next post ! :)
Team feature
I deployed the new feature pack I was working one these last weeks.
Many changes, both on backend services and front end to ease configuration sharing, access rights management and overall experience :)
What's in a team
- A team gathers many whisperers to share them to a list of users
- A team also provides common settings that are automatically set on the UI when selecting a team:
- Shared saved queries
- Shared clients and replicas patterns
- Shared set of plugins
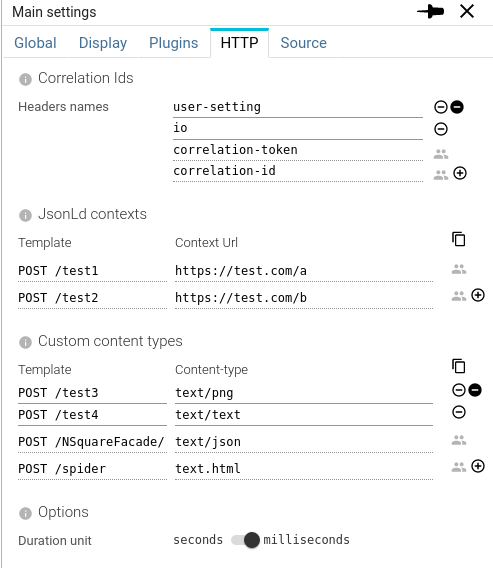
- Shared set of correlation id headers, jsonld contexts, custom content types
All those settings are complementing your own settings when the team is selected.
This allows configuring Spider only once for a software you're working at, and then sharing it to all users that won't have to configure Spider themselves.
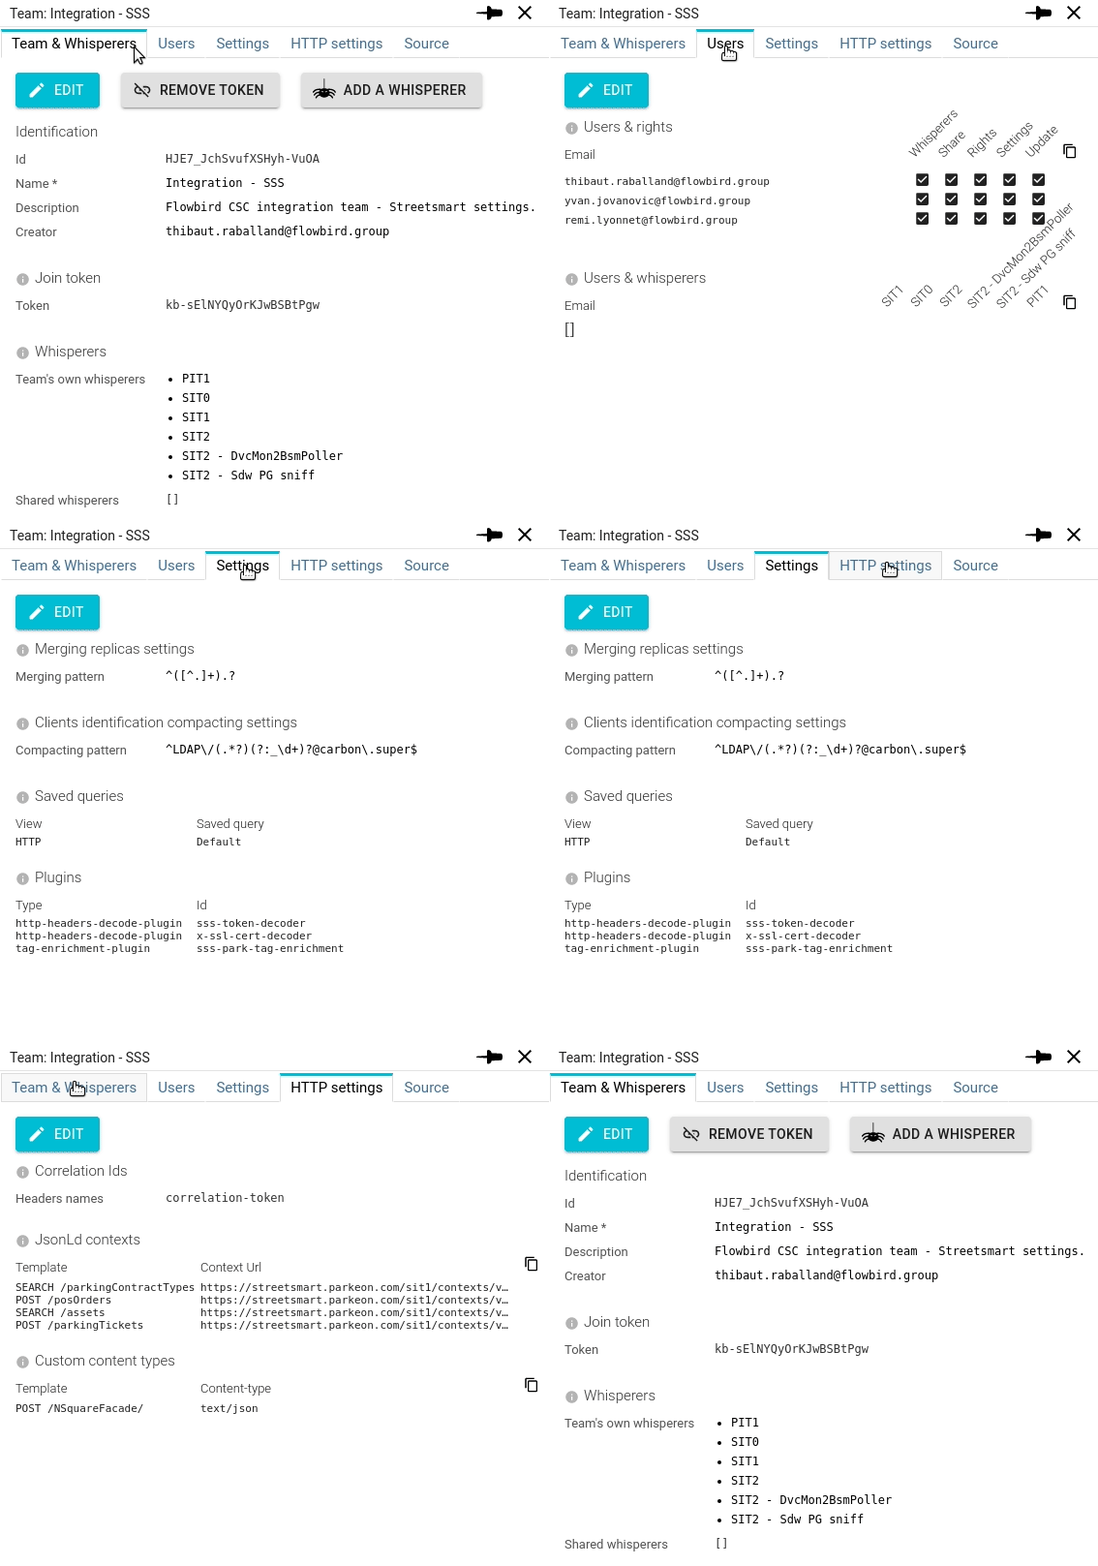
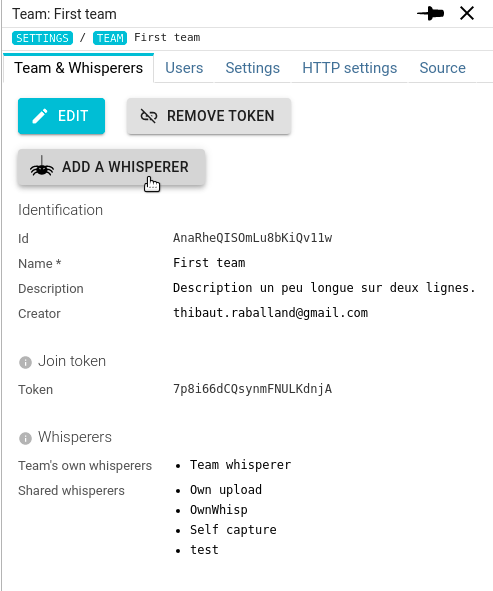
Configuring a team
Joining a team with a token
Teams may be joined easily using a shared token. Thus simplifying the onboarding of new team members.
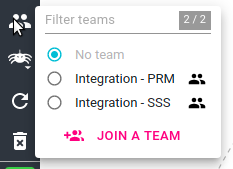
1. Open the team icon in the menu
2. Click "join a team"
3. Paste the token in the input and press enter
4. That's all!
Then, to have access to the team whisperers and settings:
Adding user manually to a team
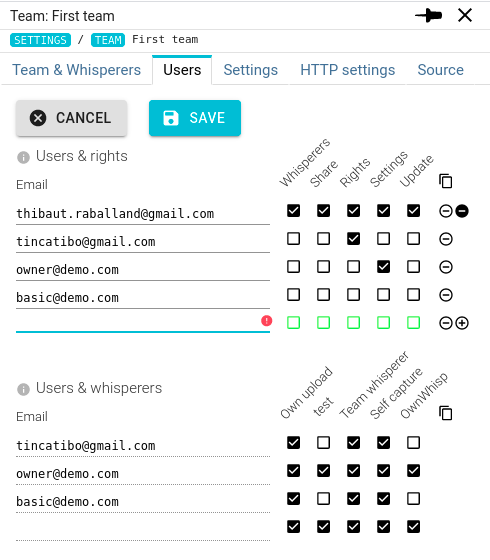
Users may also be added manually to teams, in the Users tab.
Some team members may have extra rights to configure the team, or, in the opposite way, a limited access to only a subset of whisperers.
This simplifies management of users and rights.
Adding Whisperers
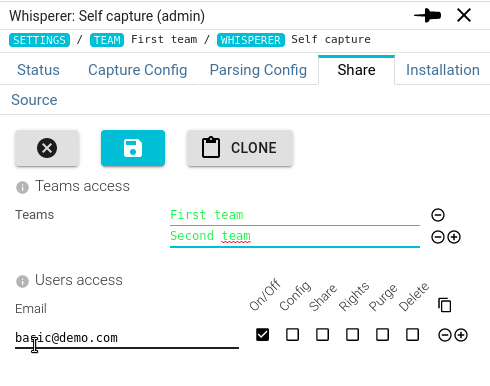
Whisperers can be added to a team by:
- Creating them from the team
- Or by sharing a Whisperer to the team
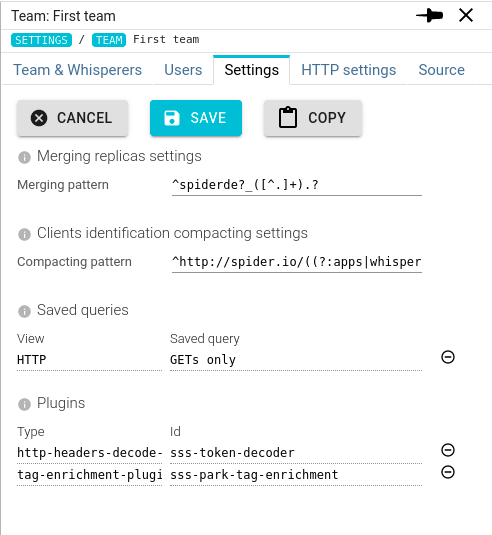
Configuring team settings
Some common UI settings may bet set at the team level. Those settings like loaded plugins, or available saved queries are then available to all team members when they have selected a team.
Some settings are also available for the specific protocol analyser (HTTP here).
Using teams
- Open the team selection in the menu
- Selection the team by clicking on the radio button.
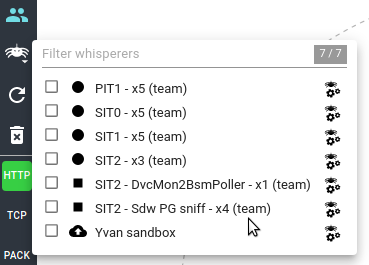
- Then open whisperers selection panel, as usual:
Team whisperers are marked by a (team) tag.
Then, on you settings tab, you may see what settings are from the team or your own.
Team settings, and plugins are marked with a small team icon aside.
In the same way, team shared queries are marked:
I hope all these features will help onboarding Spider for all newcomers, and help scale the usage across many teams :)
Technically
Technically, when selecting a team, the UI is asking a specific team token that will merge the own user rights with the team whisperers and the users rights on the team.
Thus giving the user access to all Whisperers without many changes in the other services, and without increasing the token size for users. It's getting even smaller for some :)
This feature is 'dynamic' token, built on the fly and reuse through other calls is smart and useful. This idea has been reused for the impersonate feature to test the services and UIs!
Teams API documentation is available here: https://spider-analyzer.io/home/api/#/Teams, and Spider resource diagram has been updated:
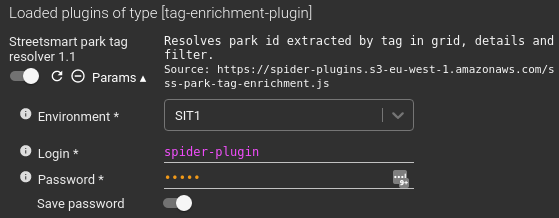
Save password for Plugins
Previously, password type parameters in plugins were not saved in user settings.
Passwords were still saved in the local storage, but not sent to Spider backoffice.
If the credentials used for the plugin are not so important and of no risk, you may choose to save them in Spider user settings. For this, switch the toggle below the password parameter in the plugins settings. Nothing special to do in the plugin manifest !
Timeline upgrade ! Better zoom out UX and tooltips!
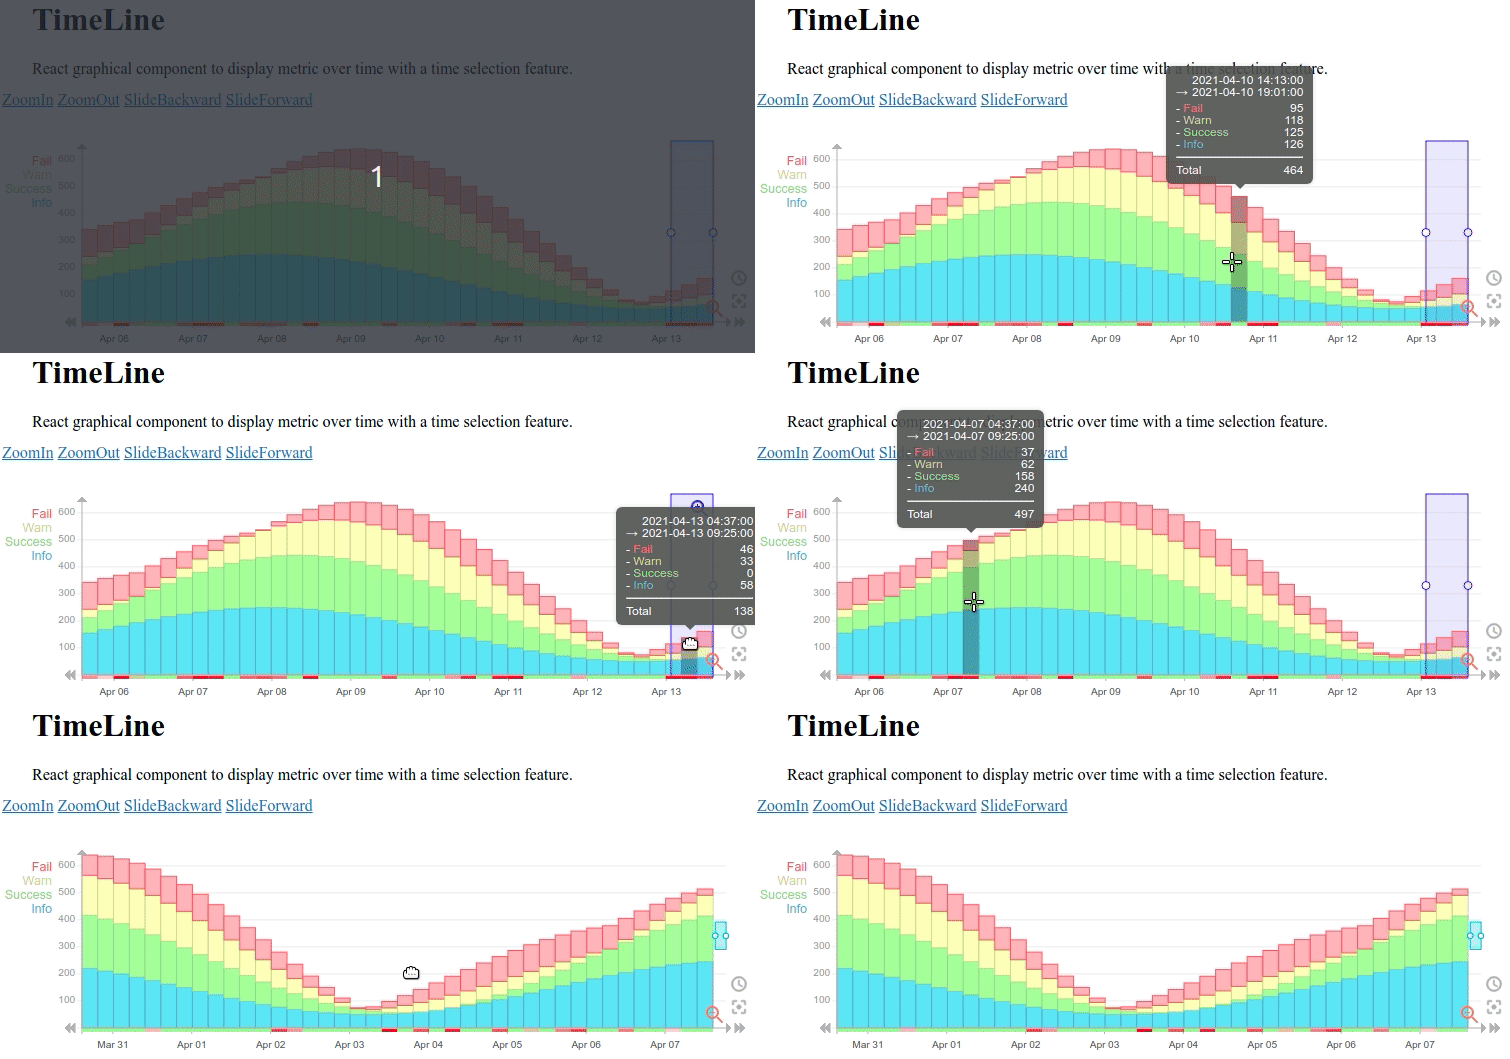
Some weeks ago, Timeline did not allow to zoom out from start.
- You could only zoom out to get back to zoomed in.
- On Spider, the default Timeline zoom was displaying all data.
That was an issue for performance, as getting the min and max of data across all historical indices was long (300ms to 5s). So I moved to a fixed zoom level based on the current time, and the ability to zoom out from start.
This was faster, and less stress for the server. Nice.
But then the Timeline UX was not good. When sliding the Timeline at first, the TimeLine was enlarging its domain instead sliding. This was linked to previous (no zoom) fashion, but was not anymore welcome.
So I did some feature removal and code cleaning. Removing some bugs on the way, and now, TimeLine sliding and initial zoom out is much better. With proper management of the domain limits (maxDomain).
This is v3.0 of Timeline: https://www.npmjs.com/package/@spider-analyzer/timeline/v/3.0.0
The zoom out factor can be set in the props!
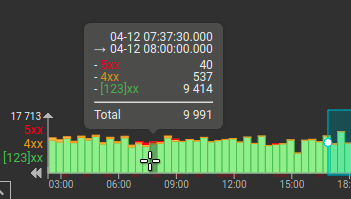
Timeline tooltips
This was a request from Streetsmart team:
Implementing tooltips to display metrics information over the Timeline.
At first, it seems simple, but it was not.
- Indeed, HTML allows only one element to capture the 'onMouseOver' event. The first one under the mouse usually.
- And either the Dragoverlay layer or the Cursor layer were already capturing it.
- So, the histograms bar could not.
Then, I add to di it the old way:
- Compute the position on the mouse in the referential of the histogram
- Determine what bar was hovered
- Send the information to the histogram component
- And then display a darkening rectangle to show the hover effect.
- I also delayed the tooltip appearance, as a whole for the histogram, with a straight setTimeout, that is cleared onMouseOut
For better UX,
- Tooltips are hidden when sliding the Timeline or dragging/drawing the time selection.
All custom made :) But it rocks!
It is deployed on Spider Network and Monitoring UIs, and will be soon on Streetsmart!
The tooltip content as well as look and feel can be easily customized with component props and CSS.
This is v3.1: https://www.npmjs.com/package/@spider-analyzer/timeline/v/3.1.0
