Monitoring - New Performance view
· One min read
I added a new view to monitoring. And thanks to the big refactors of last year... this was bloody easy :)
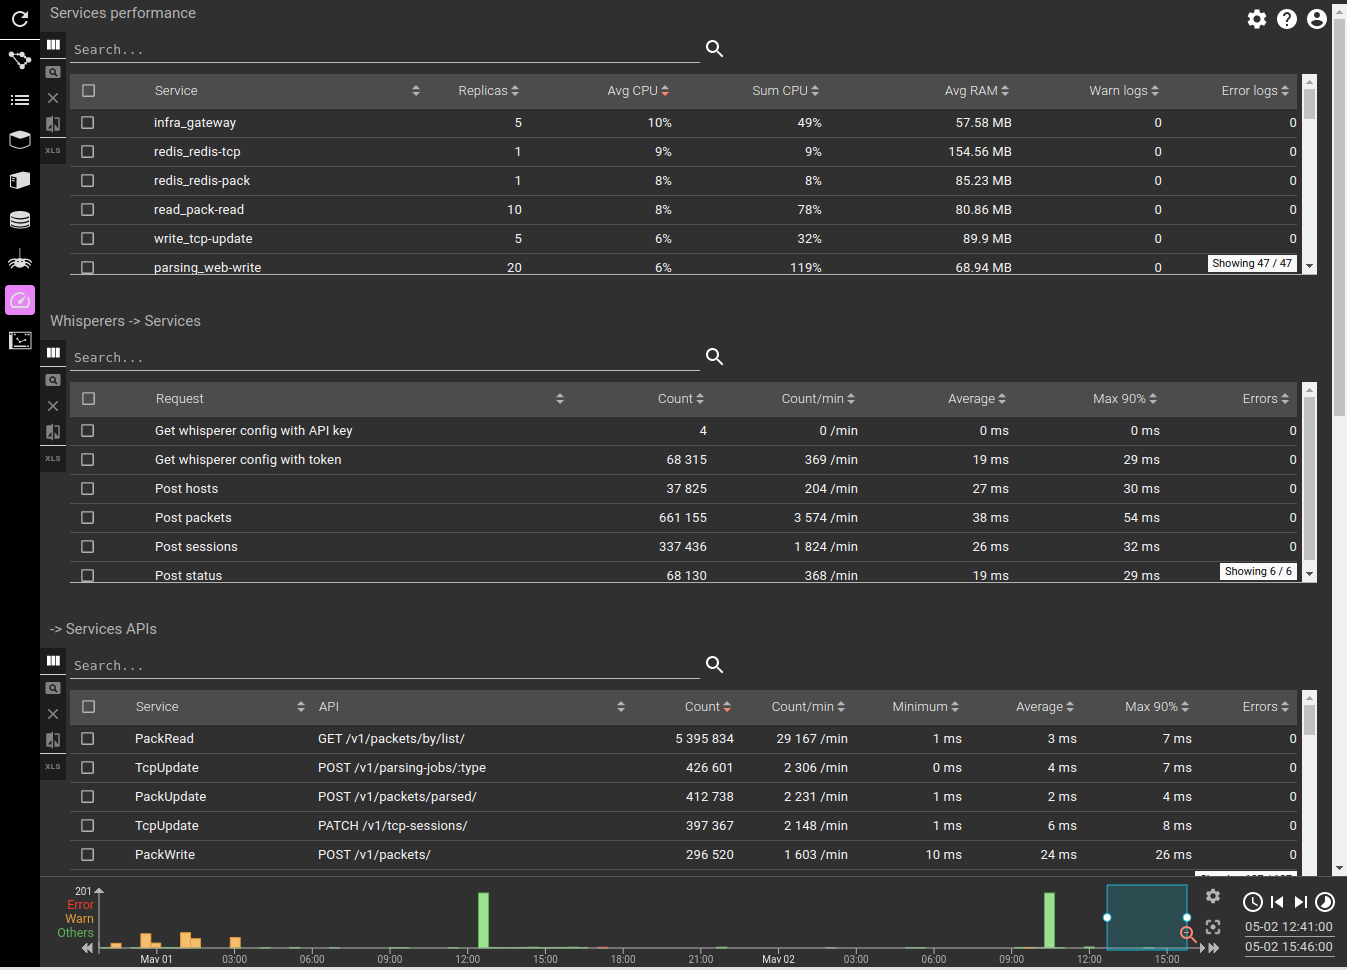
This view adds several grids to get performance statistics over the period:
- Services performance
- Replicas, CPU, RAM, Errors
- Whisperers -> Services communications
- Services API
- Services -> Services communications
- Services -> Elasticsearch
- Services -> Redis
- For all: Load, Latency, Errors
