Monitoring improvements
· 2 min read
Since Spider moved to the Kube, I needed to fix some of the monitoring dashboards to work on Kubernetes.
Here are the changes:
Elasticsearch metrics
Elasticsearch cluster is now hosted on the Kube an not on specific servers.
The monitoring UI now supports both situation: it detects if it is hosted on Kube or not, and adapts the queries in consequence.
Main dashboard changes
The main dashboard got a few changes:
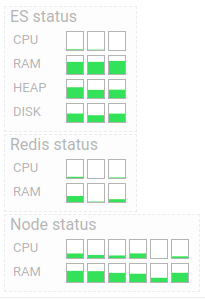
- ES disk Gaugues is monitoring ES persistent volumes
- ES CPU and RAM Gaugues have their maximum set to the resource limits of ES PODs
- Nodes status are showing all Nodes of the Kubernetes cluster, Spider being on them or not.
- A Redis status box has been added to monitor Redis CPU and RAM usage, taking into account the maximum RAM set in setup.

Logs dashboard changes
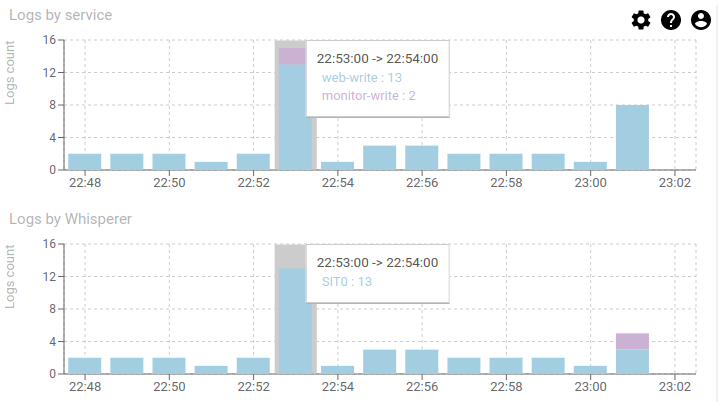
I improved logs dashboard since the two main charts (warning and errors) where not very useful:
- Logs by service is now showing how many errors and warning logs have been generated by service
- Logs by Whisperer is now showing how many where linked to what Whisperer
- If all logs are from same Whisperer, the issue is more on the observed environment than on Spider

Whisperer dashboard changes
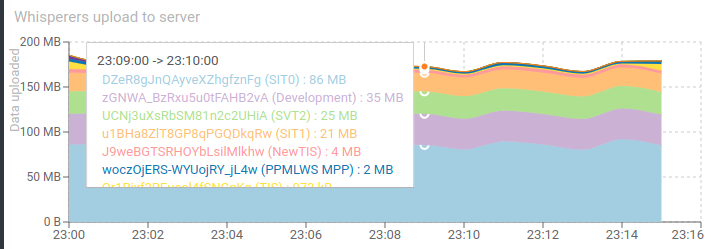
The Whisperers upload to server graph is now showing the total of uploaded data by whisperer, not by instance.
This is more relevant.
