One service in Spider back-end has been growing too much. It included:
- Whisperer configurations
- Users rights on this Whisperer
- Whisperer current status
- Whisperer status history
- Whisperer hosts resolving
The last 2 were on different indices, but the 3 first 'data aggregates' were inside the same resource/document.
This resulted in a complex service to update, in conflicts in Optimistic Concurrency management, and in slow response time due to the size of the resources.
It needed split.
I firstly tried to split it logically from the resource perspective, extracting the configuration as it is the most stable data... But this was a bad idea: splitting configuration and rights was complexifying a lot the access and usage of the resources from the UI and the other services that needed the information!
So I figured out I had to split the monolith from the client perspective.
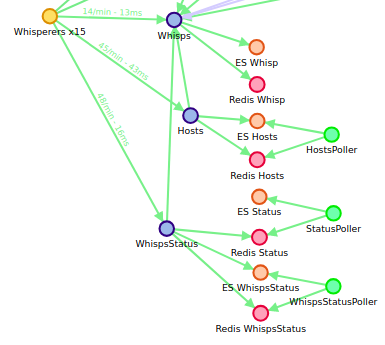
In result, I extracted from the first module:
- An operating service to process status input and to store both status and current status
- An operating service to process hosts input and to store them
- A configuration service to manage configuration and rights
This was much better. But I had slowness due to the fact that all those modules were accessing and storing to ES directly. So, I switch to saving in Redis and configure pollers to serialize the data to ES. Everything was already available to do this easily from the saving processes of Packets, Sessions and Http communications. I also added a pure cache to Whisperer configs resources:
- On save, save in Redis and ES
- On read, read from Redis, and if not, read from ES and save in Redis
All in all, requests from Whisperers clients went from 200ms+ to save Status or Hosts to... 50 and 15 ms ;-) Yeah !!