Upgrade to ES 6.4.1
· One min read
Spider has been upgraded to ElasticSearch 6.4.1 !!
It now benefits to APM access, SQL queries and so on :-) I'll tell you more later.
Spider has been upgraded to ElasticSearch 6.4.1 !!
It now benefits to APM access, SQL queries and so on :-) I'll tell you more later.
On request from Remi L., I increased priority of this feature last week, and it is released today :-)
It is now possible to:

Beware though: if the request or response body was encoded (gzipped or chunked for instance), it is still encoded, as transmitted on the wire.
This feature, linked to the 'Diff' feature previously released adds even more power to Spider as a killer tool for integration :-)
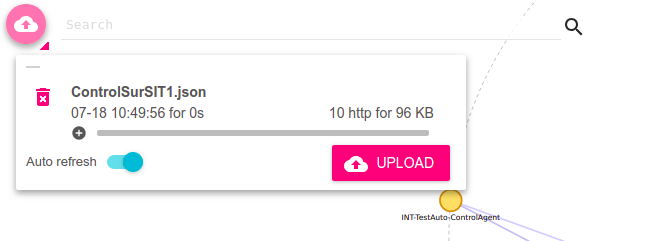
Anybody can export. However, you need to have your own Whisperer of UPLOAD type to be able to import back.
Cheers, Thibaut
Network map got a small improvement:

This option is active when Merge option is active.

NB: This feature is not present on the sequence diagram.
I added information for easier reading of sequence diagrams:
The relative time since the beginning of the sequence diagram is now display right to the time axis.
Thanks Aless for the tip!

After the second/third processing of production statistics, we can say that, although they are very easy to generate, the processing of the screenshot export are slow and painful !
So I shifted priorities, and invested some time in Excel export :)
And now, all statistics information can be exported to an Excel spreadsheet in one click. They include:
Thanks https://github.com/guyonroche/exceljs for the very nice library!
Response time statistics of GET parks/areas 
Excel export: Spider stats - Duration
Response time statistics on SIT1 by service, url, verb and status (truncated)
Excel export: Spider stats - Duration, group by Server (merged), URL templates, Verb, Status
Enjoy! Thibaut
Special dedicace to Bertrand R.! :)
I added a new column 'links' in HTTP grid. For now, it tells you if Correlation Ids has been found on a communication, and, if yes, allow you to filter on them with one click, and even to open the related sequence diagram by clicking while holding shift.

Analysing Controls or Rights calls fan outs has never been simpler ;-)
Result:
Note: a new setting is needed to list Correlation Ids headers to watch. It is valued with Streetsmart correlation-token header by default in Streetsmart server configuration.

PS: Timeboxed in 3 hours ;)
I love React. Reuse of components is just so easy!
I added 'shortcuts' to filters in the columns headers of the grid. That will fasten your work and I hope improve the User Experience :-)
Nicolas C. suggested it, and I had it in my roadmap... but I never actually thought how to do it. And after some thinking, I found an solution so easy and reusing existing ones that... here are they, a couple of hours later =)
Enjoy!
Filter for items

Filter for range


First step autocompletion has been added to search inputs :) !! Now, you can type in the fields name much faster !

Next step... suggestion of values!
You may now perform a diff between selected items in Spider :)
Enjoy, and leave a comment! Especially for any bugs... this is first release, and will surely improve ;-)
First, select communications to compare, and click Compare icon:
Global tab show metadata from communications, yellow cells mark differences.
Headers tab shows diff in headers.
And Request bodies and Response bodies tabs show differences in formatted content. 

Cheers, Thibaut

