PostgreSQL Parsing
Deep, protocol-level database observability — without instrumentation, without SQL logs.
I'm excited to announce a major new capability in Spider Analyzer: native PostgreSQL wire-protocol parsing!
This feature takes Spider’s network observability one step further by decoding actual PostgreSQL protocol messages directly from live traffic — giving you precise, structured insight into what your applications really do with your database, at runtime, and at scale. 💪
Why PostgreSQL parsing matters
Traditional database observability usually relies on one (or more) of the following:
- Application-side SQL logging
- Database logs (often sampled or truncated)
- Query stats aggregated at the engine level
- Instrumentation libraries embedded in the code
Each of these approaches has trade-offs: missing context, performance impact, partial visibility, or operational complexity.
They are useful, but they often miss:
- The exact query flow
- Prepared statements and extended queries
- Transaction boundaries
- Real execution ordering
- Cross-service correlations
Spider takes a different path.
By decoding PostgreSQL traffic on the wire, Spider observes queries exactly as they are executed, regardless of language, ORM, framework, or deployment model.
- No application code changes.
- No PostgreSQL configuration changes.
- No SQL logging required.
It provides deep visibility while preserving runtime realism and performance isolation. You're seeing what was actually sent over the network, in the exact order PostgreSQL processed it.
What Spider decodes from PostgreSQL traffic
Spider understands the PostgreSQL protocol at a semantic level, including both simple and extended query flows.
That means Spider reconstructs complete logical database interactions from low-level messages such as:
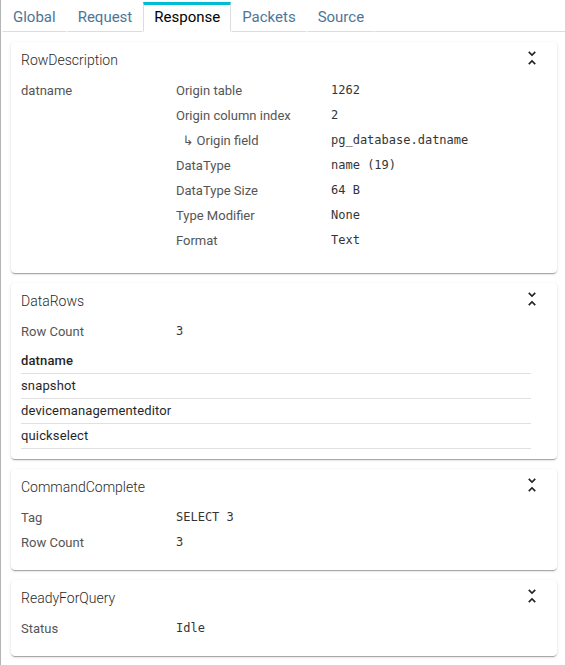
QueryParse,Bind,Describe,Execute,SyncRowDescription,DataRowCommandCompleteReadyForQuery
From these messages, Spider builds PostgreSQL Communications: high-level, structured representations of database activity.
Messages are reconstructed and linked to contextual information:
- Source workload
- Target database
- User
- Returned row count
Spider also follows cursors, portals and prepared statements used, so that:
- Any SQL execution to their original query
- Any result dataset is linked to the original query and the requested fields
You may explore the full data model here: PostgreSQL communications
From protocol messages to semantic database intelligence
What makes Spider PostgreSQL parsing truly powerful is not just seeing queries, but understanding their intent.
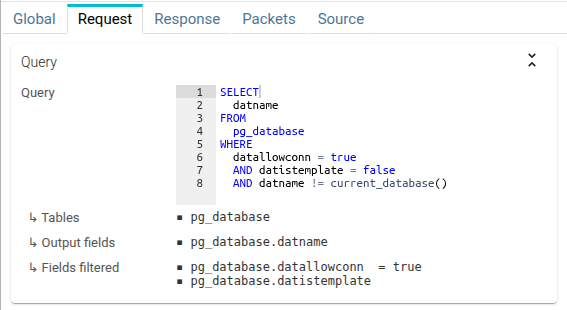
Each reconstructed communication is enriched into a semantic model, including:
- Operation type (SELECT, INSERT, UPDATE, DELETE, transaction control, …)
- Tables involved
- Table fields read, written, joined, or filtered
- Returned columns
This data is indexed, searchable, and correlated across the rest of Spider’s observability model.
It enables questions like:
- Which services read from this table?
- Which tables are most used?
- Which queries touch sensitive columns?
- What database activity preceded an incident?
- How did query behavior change after a deployment?
- What are the most frequent queries?
- What are the slowest queries?
From database intelligence to business-centric observability
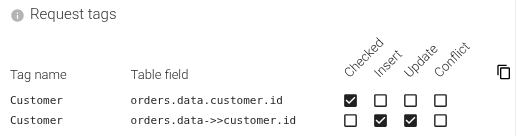
Going even further, Spider tagging features enable you to extract and correlate data from any PostgreSQL communication.
You can tag communications with the customer name, the order id, any of your own business attributes involved.
Just designating the table fields you want to correlate on is enough for Spider to track them on any request and response!
It enables questions like:
- Which customers are most likely to experience a slow query?
- What is the flow of a specific order, when was it changed?
- Do we have a disparity of performance between customers?
- etc.
Spider also supports JSONB subfields extraction: you can extract and correlate any JSON field stored inside your JSONB columns as they flow in INSERTs, UPDATEs and SELECTs.
Spider changes to enable PostgreSQL parsing
Services
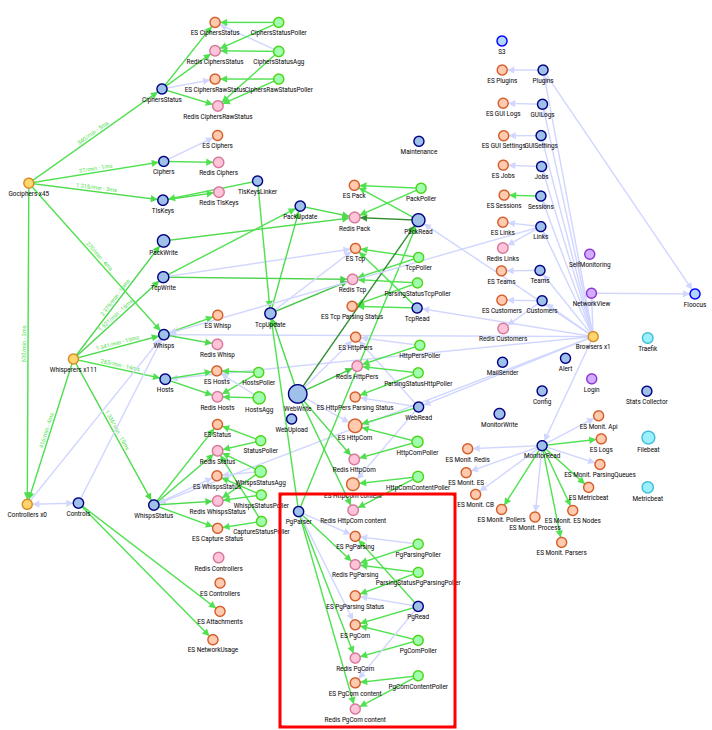
Following Spider CQRS model, 2 new services have been added to Spider:
- Pg parser
- Pg read
And 4 new pollers have been configured (same code as others) for Redis -> Elasticsearch bufferisation and synchronization.
Storage
- A set of new indices has been defined in Elasticsearch, associated to the same ILM and DSP as HTTP ones.
- A new redis instance, dedicated to PostgreSQL parsing, has been added to the cluster.
UI
On the UI... accessing PostgreSQL communications is one click away: a new PSQL view has been added to the menu.

You then have access to nearly all existing Spider analysis and visualisation features:
- Timeline, filter & search
- Map & Dashboard
- Grid, Sequence diagram & Stats
Some specific features are still missing, like diff, public links and import/export, but they are coming soon!
Configuration
As usual, everything is configurable within the UI - PostgreSQL Parsing
-
Enable PostgreSQL parsing in the Whisperer settings.
It is now enabled by default on PostgreSQL official port 5432.

-
Define any filtering option:

-
Define any Query templates - using regular expressions - to give business names to recurrent queries.

-
Set any Tag extraction from your Table fields.
Monitoring
PostgreSQL parsing is fully integrated with Spider monitoring.
Summary status integrates PostgreSQL parsing metrics:
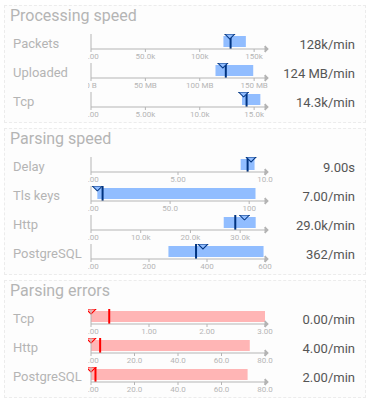
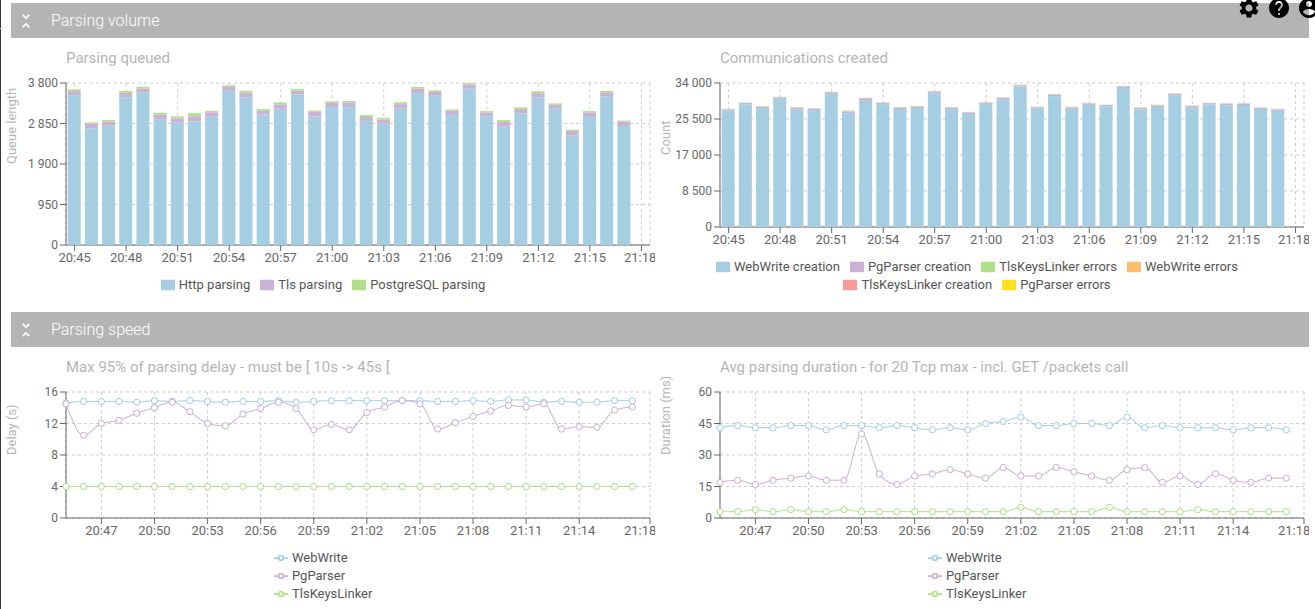
Parsing dashboard integrates PostgreSQL parsing metrics as well:
Setup
Activating PostgreSQL parsing is a single configuration change.
But as you may not be using PostgreSQL, you can avoid the extra microservices and indices deployment by disabling PostgreSQL parsing in the Helmchart.
Spider Helmchart activates or not PostgreSQL parsing with a feature flag.
Performance tests of PostgreSQL parsing
Thanks to Kanstantin's performance testing work, I was able to capture PostgreSQL communications when he was simulating a real-traffic workload on our business distributed system!
The results are promising:
- Performance is as fast if not faster than Spider HTTP parsing.
- Parsing works consistently even on hours-long TCP sessions.
- Concurrent execution like pipeline is supported.
- All this, even including TLS deciphering phase!
I've even added management of a few weird cases not supposed to happen... but that Hangfire and Zalando operator factually do. 😅
As you may notice in the monitoring screenshots above, the average parsing duration for PostgreSQL communications is one third lower than HTTP ones!
This may be because PostgreSQL protocol is stricter and binary compared to HTTP text-based protocol.
And... I've added a good set of caching layers to Spider to speed up the decoding process - which I can't with HTTP parsing! ;)
Conclusion - A new layer of database observability
With PostgreSQL protocol parsing, Spider connects:
- Network reality (what flows on the wire)
- Runtime context (which workloads are involved)
- Database semantics (what the queries actually do)
This creates a shared, factual view of database usage — invaluable for:
- Architecture analysis
- Performance troubleshooting
- Security and compliance
- SQL lineage and impact analysis
And it does so without relying on logs, sampling, or application-level instrumentation!