Sequence diagrams are in!

· One min read

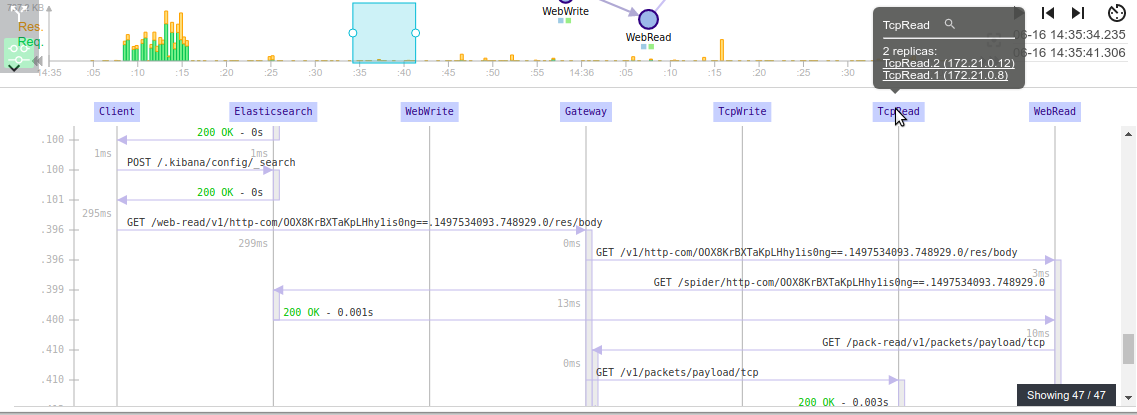
Long time promised, here they come. Official release of automatic sequence diagrams representation in Spider.

  • Available for the 3 current views: HTTP, TCP and Packet.
  • Model the different actors from the servers IP
  • Display requests, responses and timeline of all communications
  • Display time on the left axis (non linear)
  • Automatic layout with clients on the left, and servers on the right. In order of communication
  • Allow opening a communication by clicking on it

Here is a sample for a Controls request on Streetsmart:

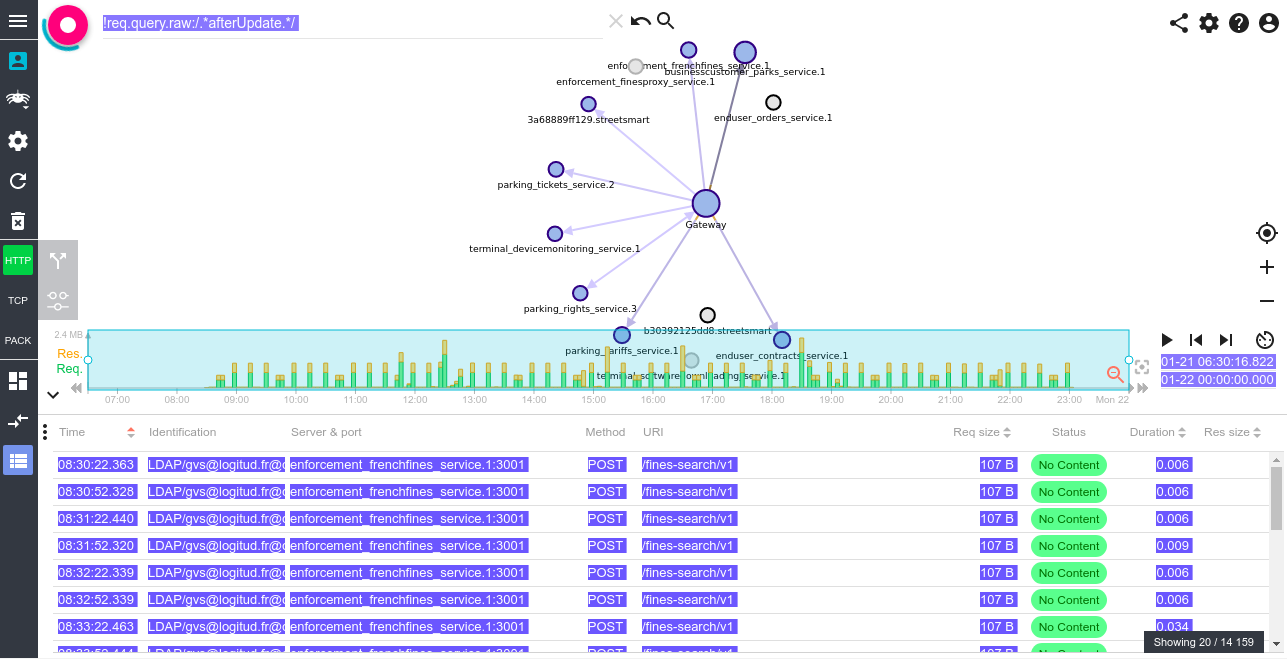
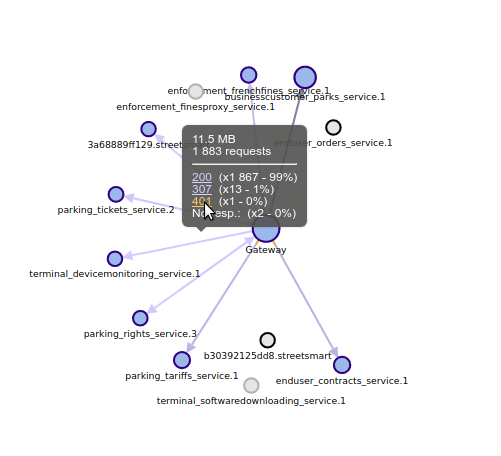
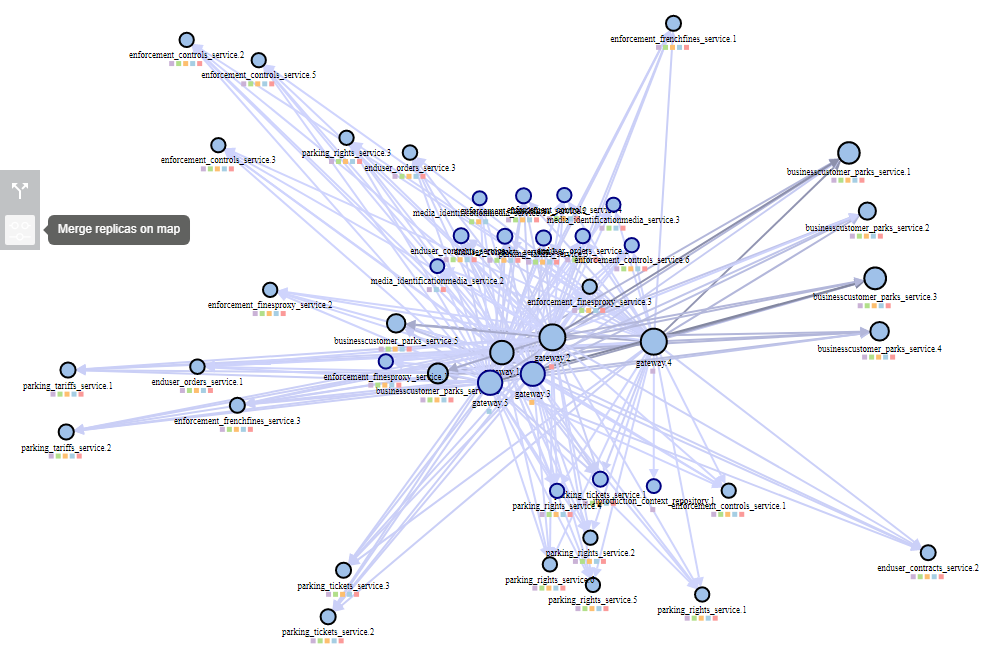
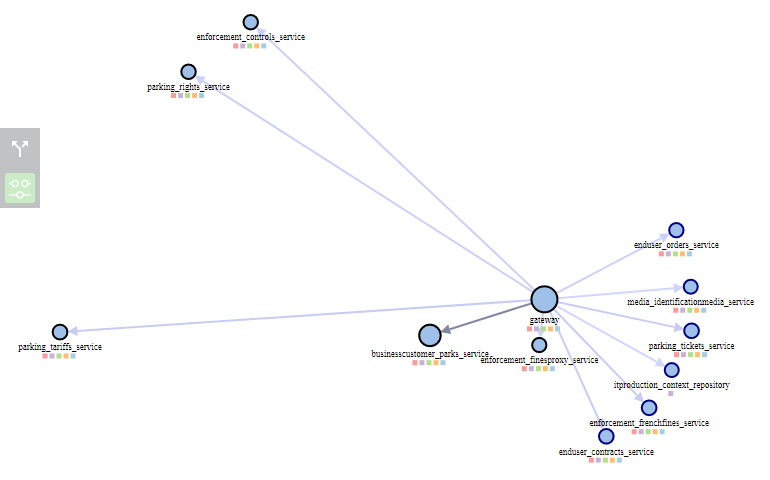
As the calls way and back to the reverse proxies in HTTP sequence diagram can be annoying, I implemented an automatic filtering of the reverse proxies:

Reverse proxies hiding!

  • Spider will build the diagram be using the Origin client of the request (as communicated in x-forwarded-for header)
    • This show direct communications between original client and target server.
    • BUT, the communications are not merged. They are just hidden: You only see the HTTP request behind the last proxy.
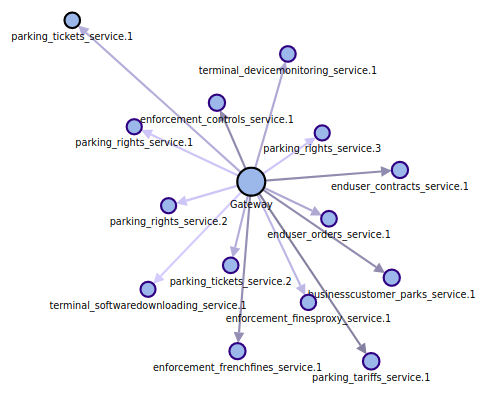
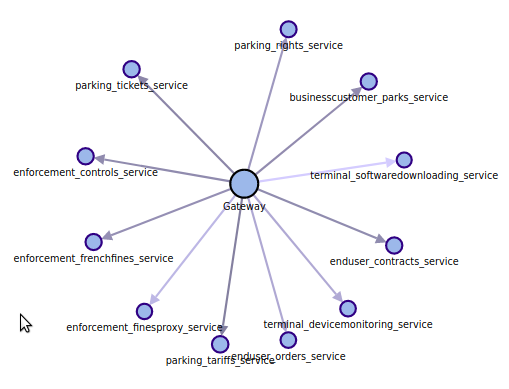
  • This applies to both the network map and the sequence diagram.

To use it, click on the icon option next to the HTTP view icon.

URL decoding of HTTP request URL parts

· One min read

Small change, but that can help using Spider a lot:

  • The URI, querystring, and hash parts of the HTTP requests are automatically URL decoded in Spider resource.
    • You can now search without all the %2B and such.
    • And querystring are better displayed both in grid, and in detail panel

Architecture improvements

· 8 min read

Many things have evolved since last time I wrote here.

Spider went from monitoring 5 000 packets by minutes to 45 000 packets by minute, with more than one month system stability. And it was some challenge. Indeed, one goal was to limit at maximum the size of the needed servers.

The architecture changes I put in place are as follows:

Queues on Whisperers

First, Whisperers were sending packets on the fly in asynchronous mode, without carrying much on results (except for circuit breaker).

Now, they have a limited number of simultaneous connections to back office, with a queue for stocking packets to send later. This is similar to a connection pool for DB. When packets overflow the pool, this is tracked in the monitoring.

This allows smoothing spikes of network traffic on the client side to reduce the impact on the server.

Avoid retry pattern

Retry pattern is bad in real time systems.

I had several retry implemented throughout the system to handle occasional 503 or time outs. And to handle synchronisation delay between packets and sessions.

The issue is that when something get bad, referring helps getting the process done, but new comers get stacked up. And the issues accumulate. Especially if getting don't solve the previous one and you have been delaying processing for many seconds.

I removed retrials done during processing to keep only those for configuration and synchronisation (polling).

Errors on processing are marked and reprocessed once by another process ten minutes after. Then I can get errors on the fly, most of them being solved later. If not, then, they are definitely errors.

Don't forget Node.js event loop

Node is mono threaded. For it to answer to connection requests, you have to give the have back to the event loop as soon as you can.

I added setImmediate calls in the processing loops, this got rid of most of my 503s.

Limit Redis volatile keys

Redis is a great in memory database. It gives building blocks for many many architecture patterns.

However, things that looks easy out of the box need to be taken with care. There is no magic.

Redis has a feature of automatic removal of volatile keys. However, to find keys to remove, Redis pick 20 keys at random every 100 ms, and if more than 25% keys were to be removed, it loops!

As I am using Redis as a write ahead cache, I use volatile keys to clean the DB automatically. But at the end, this kills Redis performance, and I had timeouts while calling Redis! Keys should be removed explicitely whenever possible.

I made many changes in the data flows to remove processed data from Redis as spoons as the data was synchronized in ES and not needed any more for real time processing. This brings a lot of complexity in the data flow, but this is pretty much handled at 75% by setting lifecycle to resources and checking it in the pollers. Only exception is packets that are asked to be removed from Redis by the parsers.

All this made Spider go from 50 000 items stored in Redis in continuous flow to... 400 ;-) And from timeouts to Redis, I achieve now 20 ms in max 99% !!

RTFM they say =)

I also moved Redis outside the Swarm. Indeed, I found issues in stability of Redis in Alpine containers.

Use Redis Lua scripting

Manual removal of items from Redis implied pipelining lots of instructions and complex preparation on client side.

Redis documentation advises against it, and favor going to Lua server side scripting now. Lua is integrated in Redis and allow scripting Redis calls, while manipulating and checking Redis responses while still on the server. It also allows parsing and modifying JSON objects and can return values, arrays or hashes to the client.

The scripts do not need to be send to Redis for each request and are cached on the server. The client can call a script execution using the SHA signature of the script. Simply enough, my microservices subscribe the scripts to Redis at start, or on Redis reconnection.

My main difficulty was to understand enough of Lua to do the scripts I needed knowing there is no example of 'complex' scripts available in the web resources. And there is no debugging embedded in current Redis version (but it is coming!).

The performance improvement is huge, and this simplifies much the client processing. But it must be keep in mind that, as the processing is done on Redis server side, it is less scalable than when performed in the application layer.

Use automatic Id generation in ES

When you index in Elasticsearch, you may provide the id of the document, or let ES generate it.

Choosing a good id as much performance impact on the indexing process.

Providing the id on the applications layer is easier for direct access and updates. However, this makes ES search for a document with existing id whenever you index. In order to update it, or not.

This slows down indexing.

If you don't provide the id, ES generates on the fly a global unique id for each document, and don't check previous existence. Much faster.

I moved packet indexation to automatic ids, since I never update them.

Adapt ES refresh rate

Another quick indexing performance improvement on ES concerns refresh rate (I am already doing bulk requests all over the place). Default refresh rate is at 1s. It is the time that ES waits before closing current working segment and making it available for searching.

As ES is used for display and not any more for real time processing, I slowed down the refresh rate to 5s for packets, and 2 or 3s for web and tcp indices.

Scale your Pollers

ES is multithreaded. Rather than sending big chunks in serial, it is best to send big chunks in parallel. ES has as many indexing threads as there are cores on the servers. And when sharding is in place, it can index on all servers.

The best setting is to be found in size of index pages, number of application indexing threads and so on...

When the loading increased in Spider, I met a moment when the new packets were piling up faster than they were consumed... one command in Docker Swarm to scale the pollers, and it as settled. I love this :-)

Change NGINX settings: persistent connections and timeouts

NGINX default settings are not for system under load. They need change to be able to handle hundreds or thousands of requests by seconds to upstream servers. This own NGINX documentation is the base for first tuning actions.

Main changes applied:

  • Use HTTP 1.1 between NGINX and upstreams to keep connections open.
  • Increase timeouts for connection to upstreams (needed to be compatible with Node monothreaded architecture): proxy_*_timeout

Handle concurrency requests

When the load increase, concurrency issues show up! ;-)

  • I implemented concurrency checks in Redis thanks to Lua.
  • ES offers a great system of version control to implement custom concurrency checks. That helped me get out of it !

Think about the load spread in the cluster and avoid scaling complexity

Microservices are great for development and maintenance. However I'm often impacting many services at once when developing new features. You need good team communication to be able to work it out. No issue in my case :)

When scaling, scaling independently is definitely great. But sometimes, finding the good tuning when you need to increase scale of several dependent microservices is difficult. Polling instead of pushing is a good solution, but sometimes you need to scale B for more processing load, but B depends on A to get its data. So you need to scale A as well.

If A is doing processing (and not only offering data) this can prove a challenge.

I had the issue in Spider:

  1. Web parsing microservices was calling Packet read service
  2. The reassembling of TCP packets was made in Packet read

So, both microservices were doing heavy processing, and scaling them was difficult tuning job.

I moved the reassembling of packet knowledge to a library and included in the Web parsing microservice. This relocating the scaling need as the load was only performed on parsing module, and the Packet read was focused only on getting and formatting packets.

This simplified the configuration of the cluster. For a single heavy loaded business process, it is easier if the high CPU processing need is focused in one place.

Share your search ! (or bug ;) )

· One min read

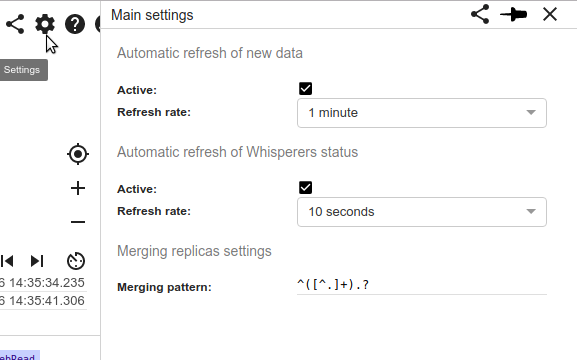
To simplify sharing information, you may now click on the Share icon at the top right of the GUI.

You may then share this link with anybody having access to this Whisperer. When opening the link in the browser, the GUI will open and display exactly (or almost) what you are currently seeing. Redux's magic ;-)

Sticky detail panel

· One min read

A brand new shiny feature from this week end: sticky details panel.

I noticed that it was difficult to use the Host stats features while changing the time to compare stats. Indeed, the selection in the timeline with located behind the detail panel.

So I added a new feature: the detail panel can be 'sticky' and takes its place on the right of the map and table, and not over them. Just click on the Pin icon of the detail panel icons to do it.

Becomes:

Enjoy :-)

Whisperer creation and installation

· One min read

A new feature has been added last week to allow easy Whisperer creation.

In the whisperer list, you may click on 'New Whisperer'. It:

  • Create a new Whisperer with a default name.
  • Associate it with your account
  • Create a default configuration as an 'UPLOAD' whisperer
  • Offers you to edit the name of the Whisperer in the details panel

You may then edit the Whisperer configuration in Capture and Parsing tabs.

For an INTERFACE Whisperer, the installation instructions are provided in the Installation tab:

This tab also allows you to generate (and change) the API key of the whisperer, used for it to connect to Spider. If lost, it needs to be generated again, as the server does not keep a copy of the private key.

For now, as we are in private beta you need a Gitlab account and authorization for downloading the Docker image to install a Whisperer.

Whisperer remote control, configuration update and monitoring

· 3 min read

Whisperer have seen a huge improvement over the past weeks:

  • They can be remotely started and stopped from the services or the GUI
  • They monitor their configuration changes and their configuration can be updated on the GUI
  • They send the available interfaces on their hosts for configuration
  • They monitor their process and allows health checking and monitoring on the server side
  • First monitoring features have been included in  the GUI

Whisperer have now 3 distinct modes:

  • INTERFACE: They are remote whisperers, installed on a host, that capture network traffic in real time
  • UPLOAD: They are whisperers dedicated to pcap uploading in Spider GUI
  • FILE: They are 'tests' whisperers, that can parse a pcap file on a host and send the file to Spider.

Remote control

The GUI displays the status of an 'INTERFACE' whisperer in the top left corner


In the order:

  1. Not visible: Whisperer is not started, or not communicating
  2. Connecting: Whisperer is starting
  3. Stopped: Whisperer is started, available, but not capturing
  4. Capturing: Whisperer is capturing data
  5. Wrong configuration: Whisperer configuration is not correct

The control of Whisperer status is made on the Whisperer detail view with the button to START/STOP CAPTURE.

Remote configuration update

Whisperer configurations can now be changed on the GUI.

The Capture Config tab sets configuration on the Whisperer sniffing agent, and the Parsing Config tab sets the configuration for the parsing on the server.


  • Help is given by clicking on the small (i) icon
  • Valid network interfaces on the Whisperer side are provided for help
  • Value correctness is checked (when possible) on the GUI side

A color code is used to display the value status:

  • Blue: this is default value, it is not specifically set for the Whisperer and comes from server default
  • Orange: modification in progress
  • Green: valid change
  • Black: value is specifically set for the whisperer
  • Red: value is not correct. An help message is provided in tooltip of the error icon.

Remote monitoring

The status of the Whisperer is send regularly to Spider.

The Whisperer details view first tab shows a summary of information:

  • Cpu usage of Whisperer on host, average since last update
  • Memory usage, instantaneous
  • Time of capture start
  • Speed of capture
  • Total of uploaded data
  • Speed of API calls to back office
  • Total of all times for this whisperer

New fields in Http Communications

· One min read

Hi,

To answer client identification problematics, I've performed a few small updates in Spider.

Now the Http Communication resource includes 2 new properties:

  • stats.src.origin: the original IP address from the client. Stored as an IP in ES, so queryable like this: stats.src.origin:"10.1.22.0/16"
  • stats.src.identification: the identified client. Extracted by:
    • The login from Basic Auth identification
    • The sub field from JWT

Both fields can be queried and aggregated upon. Both are accessible in grid (you need to disconnect/reconnect to refresh grids available columns), and in detail view.

What's more, 2 other fields have been added in grid: the response date and the x-forwarded-for request header.

Enjoy!

A distributed system needs an integrated monitoring.

· One min read

Elasticsearch, Redis, Polling Queues, Circuit breakers, REST microservices...

Got an error, a time out in logs? Who generated it, what was the load, how was the system behaving at that time? How did it recover?

If you don't have integrated monitoring, you're driving blind!

I was starting to feel this way. I dedicated this week work to develop a new app in the system that monitors all others. Other applications are existing circuit breakers stats, queue stats, and soon REST stats, and I access ElasticSearch stats and Redis stats through their APIs.

All is collected continuously,  sent to another ES index, and Kibana helped me build easy and fast reports on spider health and speed through time. Really easy when you got all your pieces already in place and easily extendable!

Architecture upgrade

· One min read

Yesterday,  Spider encountered a major architecture upgrade:

  • I moved to one index by resource type
    • To get ready for ES 6
    • To improve shards balance in the cluster
    • To reduce IO access because smaller volume resources are separated from big ones
    • To improve ES aggregations speed
  • I introduced a poller between Redis and ElasticSearch for the four main resources
    • The load constraint is now only focused on two microservices and only on Redis
    • The load on ES is smoothed
  • I added some in memory cache on Whisperer configuration access from microservices to reduce drastically unnecessary calls
  • I have now 20 microservices in my cluster, with many being multi instantiated 😎

Streesmart instance has been upgraded with a complete data purge (sorry).

Let's look how it behaves. It should be much more stable!