156 posts tagged with "features"
View All TagsStatsBar for faster navigation and to keep track
Stats panel is great ! But stats are taking too much space, and it was difficult to keep track of what stat existed. So I added a statsBar (like a task bar ;-) )
At the top of the stats panel, it tells you what stats config exists and allows you to:
- Delete a stat
- Jump directly to a stat
- See full stat description in tooltip
Moreover, when creating a new stat (empty or as a detail of a pivot table), you are automatically scrolled to it.
Big new feature: Statistics panel !!
This has been awaiting for long, and I wasn't sure what I'll come out with. The result has gone far from the first design... it does much more :-) !
- Dynamic statistics, linked to the full power of the filters already existing
- Possibility to compare stats for different selection
- Possibility to do statistics over the full selected time windows, or with a moving period inside this window
- Avg duration over 2h
- Avg duration by s over 2h are not the same stats
- Possibility to use stats to dig into analysis
- And cherry on the cake, possibility to use aggregations and have a pivot table to have a refined view of the system
- That one was tough for my brain to build ;-)
I hope you'll help me increase the potential of this part with your ideas and comments.
Example 1: Response time analysis
Response time statistics for POST and PATCH verbs on SIT1 this february 28th.
More details on the POST 200 on frenchFines, that obviously has an issue
We can see that the issue is only with our own tests (technical admin user) !
Zoom on the statistic (with the magnifying glass), and you have access to heat map, statistical distribution of the metric, and more figures.
For our case, we notice that the bad response times are all focused on specific timeset. Then, selecting any of the graphics area, you can jump to list view, and get all details needed!
Example 2: Server load
Statistics of count of requests by minute for Fines. We can see the maximum at 200 request by minutes that was performed by the technical admin.
In fact the bad response times where do to when integration team tested in non regression the concurrency issue. No need to alarm.
Example 3: Stats by URL templates
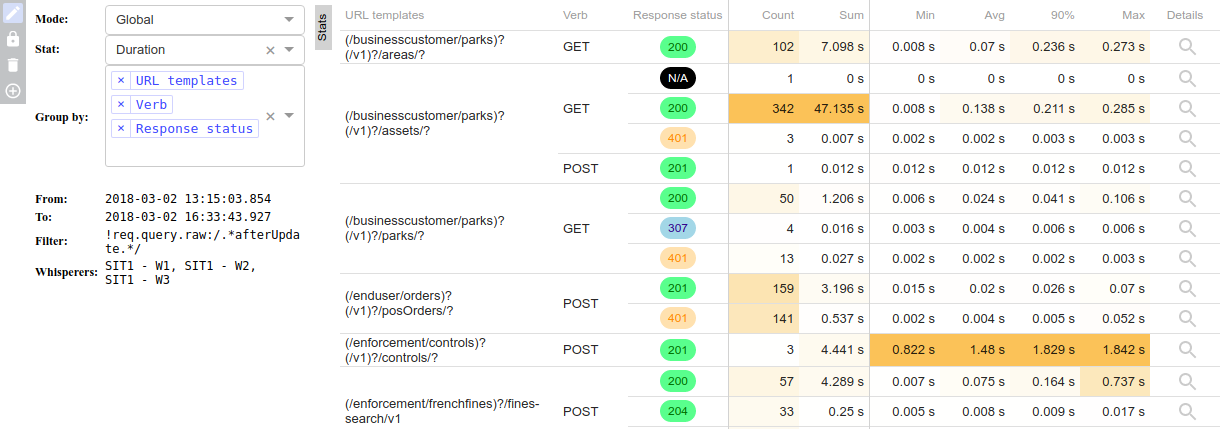
One other key features is the possibility to get statistics not by URL, but by URL templates, in order to get REST endpoint statistics! Ex:
URL templates need to be configured in Settings panel.
What's your feeling? Killing feature or not? :) Play with it and tell me what you think... and if you find bugs!
Note: For safety, I limited the number of distinct terms (URI, Servers... returned in the aggregations):
- Clients: 50
- Servers: 50
- URLs: 25
- Status codes: 50 (should be enough)
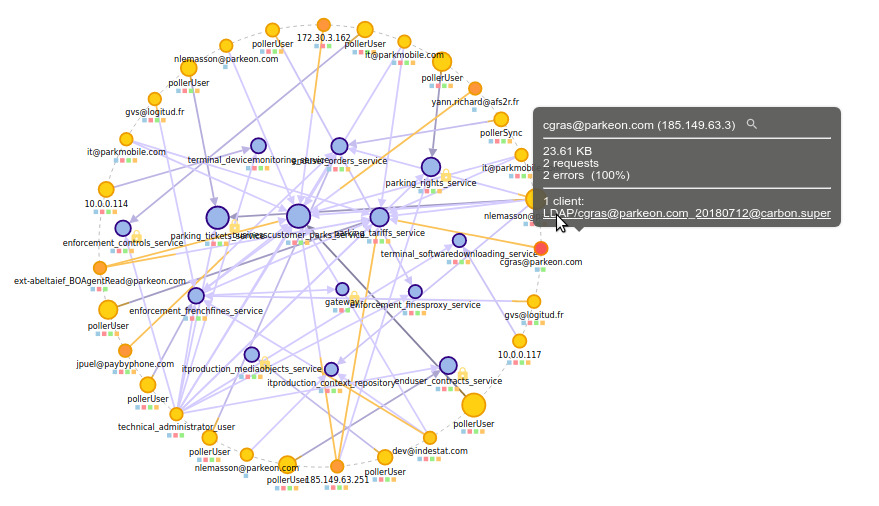
Changed U/X of map nodes with locked position
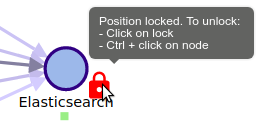
When you move a node on the map, its position is locked so that its position is no more dynamicaly calculated based on others. You could notice a locked node based on the black stroke.
You didn't? Yes... I felt like it. And Nicolas suggested an improvement.
So now, a small lock is displayed aside the locked node, with a tooltip telling you how to unlock the node position :) The ctrl+click unlock stills work, but you can also simply click on the lock.
Cheers!
Changed behavior of free search input
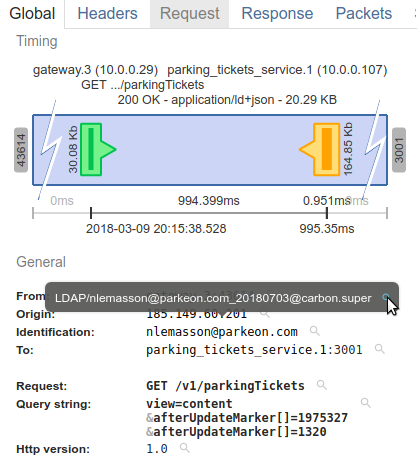
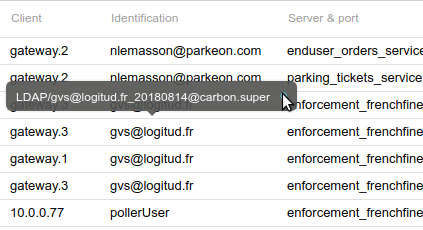
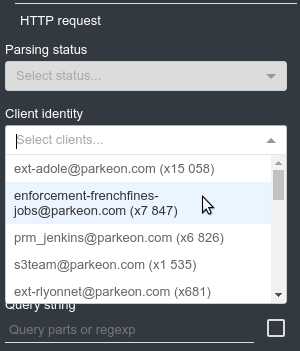
Shortened client identification in grid, filters and HTTP details
Customize the timeline metric
Although very useful to select time and track data through time, timeline is difficult to understand for newcomers.
I tried something: instead of displaying what the timeline was about, you may now change what it is about! You have the ability to select the metric which is displayed in the bar chart.
Tell me what you think about it! :-)
I did it with much refactor, so adding a new metric is about .. 5 minutes work, 10 with deployment ;-) So, if you feel any missing metric there, tell me, we'll discuss it!
Thibaut
Rights management on Whisperers
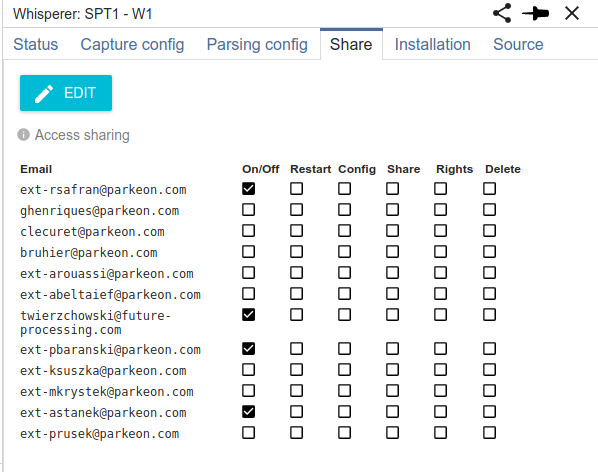
Now, aside sharing Whisperers, you may give rights to the users you share your whisperers with. Rights to...
- Start / stop
- Allows the user to change Whisperer required state from RECORDING to STOPPED and reversely
- Restart
- Allows the user to end the Whisperer, in case of issue
- May be restarted by external watchdog
- Not implemented yet
- Change configuration
- Allows the user to... change configuration ;)
- Share
- Allows the user to share the Whisperer with others
- Rights
- Allows the user to change rights associated to a user (even his own)
- Delete the whisperer
- Allows the user to delete the Whisperer
- Dangerous ;)
