Data captured
Spider captures data in two ways:
- Network usage
- Network capture
Network usage
Network usage is the higher level capture available in Spider.
It captures all network communications, by in an aggregated way, for statistics and discovery.
Gociphers inject plugins in the Linux kernel using eBpf technology to trace all calls to TCP and UDP network requests.
They count how many bytes and network messages are exchanged between any IPs over a minute, and the data is then enriched by Controllers before being serialized in Spider back end.
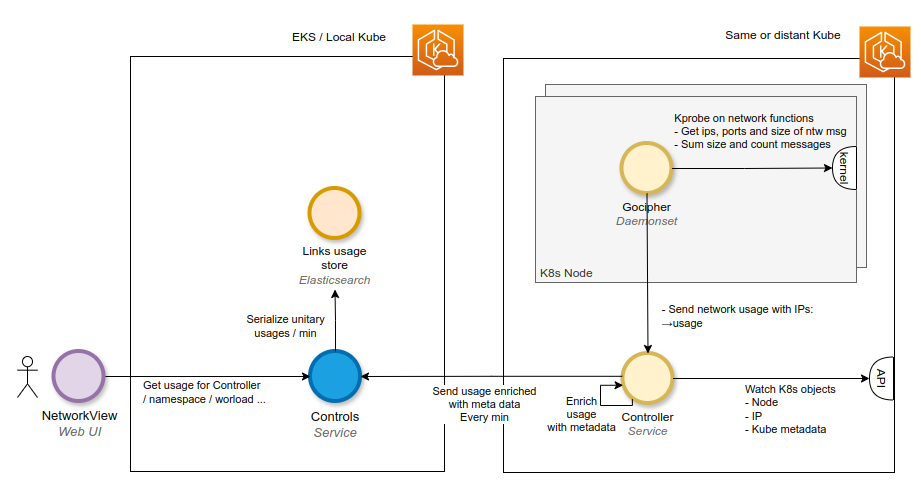
Doing so, Spider is able to show all communications happening in a Kubernetes Cluster over time.
Those are one-minute based statistics since the amount is way too huge to store in details, but it offers a very nice way to discover your systems and to spot any wierd situation you may want to dig into.
Spider then allows you to attach a Whisperer to the Workloads that concern you, and to capture the network frames in details.
Accessing Network Usage
You access Network Usage in Spider UI by selecting the Controller deployed in the Kubernetes cluster you're interested in.
You will get access to the cluster map and be able to drill down.
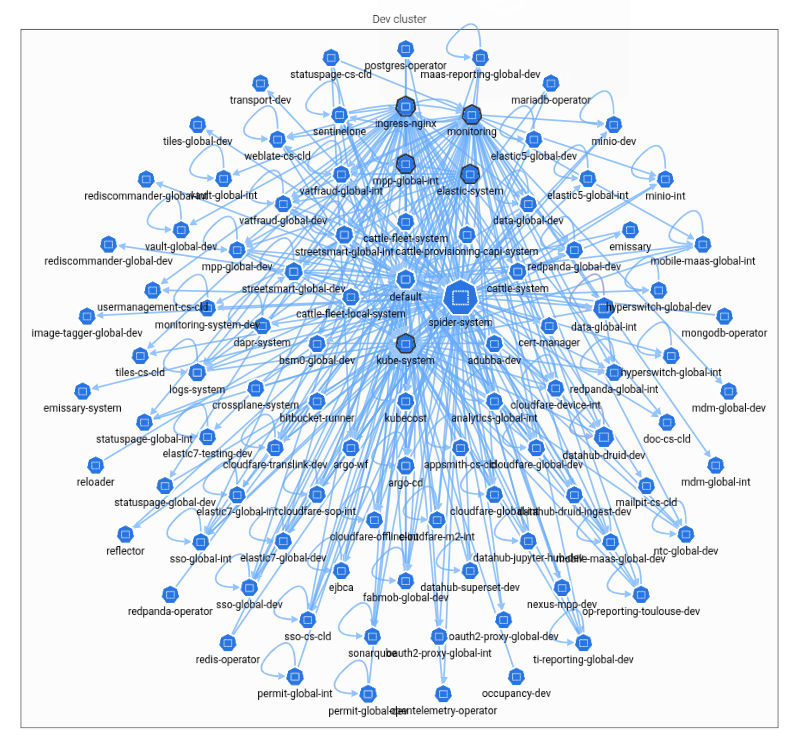
Available views
Two views of Network Usage are available:
![]()
- Logical View
- Namespaces
- Parent workloads: Deployments, Daemonsets, Statefulsets, Cronjobs.
- Physical View
- Nodes
- Namespaces
- Real workloads: Pods
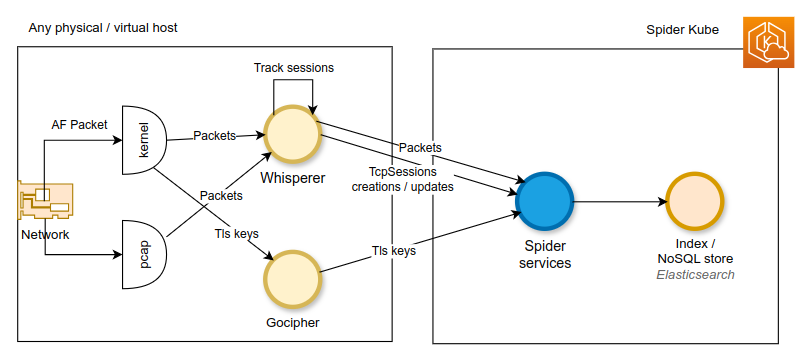
Network Capture
Network Capture is the lower level capture available in Spider.
It captures the selected network frames of the workloads the Whisperers are attached to and send them to Spider back end.
You may attach a Whisperer to any Kubernetes workloads using the Controller, or as-code using side-car pattern.
You may also spin Whisperers outside the Kubernetes cluster, and attach them to any physical or network interface of any physical or virtual host.
Only Linux is supported for now. For lack of need to support other Operating Systems.
Whisperers listen to and capture packets from the Network Interfaces, track TCP sessions and Hostnames, and send the whole at high frequency to Spider backend.
Accessing Network Capture
You may access Network Capture in Spider UI by selecting the Whisperer(s) attached to the hosts of which data you are looking for.
You will get access to the network map and be able to analyse data exchanges.
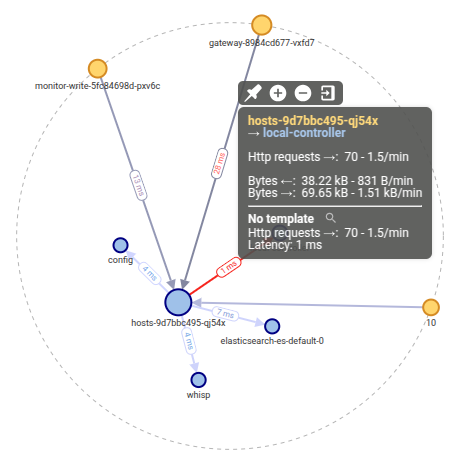
Available views
The following views of Network Capture are available:
![]()
| View | OSI network level |
|---|---|
| IP packets | L3 |
| TCP sessions | L4 |
| HTTP communications | L7 |
| PostgreSQL communications | L7 |
| Multi communications Unified view | L7 |