Technical migrations... and how much Spider is fast now !!

· 2 min read

December has been a month of migrations for Spider. And how much I'm happy to have done them! Read below.

Migration path

  • From NGINX to Traefik on 6/12
  • From Node 7 to Node 8
  • From Javascript generators to async/await programmation pattern
  • From eTags generation on full resource to eTags based on id+lastUpdate date (CPU saving)
  • From Node 8 to Node 10 (actually done in January)

The result of all this?

  1. A division by 2 to 5 of microservices CPU usage !
  2. A division by 4 to 6 of response times as seen from Whisperers !!
  3. A division by 5 to 12 of internal response times !!!

This was amazing!

I did not believe it, but yes that's proven. Node was saying that async await was faster than generators, then Google improved async/await processing speed by 8x in the V8 version embedded in Node 10.

Examples

  • Processing of packets improved from 484ms 90th percentile for 100 packets bulk request to ... 69 ms!!
  • Patching TcpSessions improved from 266ms 90th percentile to 13 ms!!! Excuse me!
  • CPU using of parsing job improved from 172% to 80% and for packets decoding, from 295% to ... 55% !! Amazing :-)
  • Previously Spider needed 4 servers to process 2500 packets/s, now... i could almost do it on two, and much much faster ! :)

Conclusion

Yes, Node.js is blazingly fast. This was right for callback mode, and now it is back for async/await ! :-)

Figures

Source: Google spreadsheet

And Streetsmart?

And you know what? Streetsmart is almost in a state before all my migrations. Imagine if migrations have the same effect for Streetsmart. It would be awesome ! :-)

Well, that's part of my plan indeed!!

Docker 18.06 and Swarm load balancer change

· 2 min read

Spider was working really fine with Docker Swarm until... Docker version 18.06.

Docker v18.06 improved load balancing scalability impact

Docker 18.06 includes a change to improve scalability of Swarm Load Balancing: https://github.com/docker/engine/pull/16. The impact on Spider is so:

  • Previously, when sniffing communications between services, the IP used were the IP of the replicas that sent/received the request (DSR mode).
  • Now, the IPs used in the packets are the VIPs (NAT mode).
  • The main issue is that... the VIPs have no PTR record in Swarm DNS, and so, the Whisperers cannot reverse resolve their names... And Spider is then much less usable.

Workaround with hosts preresolving in Whisperers

To overcome the problem, I added the possibility to give a list of Hostnames to the Whisperers that are resolved regularly against the DNS and preloaded inside the DNS resolving mecanism.

This has many advantages:

  • You can define a list of hosts without PTR records.
  • Docker resolving works better that reverse resolving (more stable: you don't face bug: )
  • The list can be given in Whisperer config (UI) or through environment variables of the Whisperer: HOSTS_TO_RESOLVE
    • Thus, you can script the Whisperer launch and get, at start, the list of services in the Swarm prior to launching.

This has a main drawback: you loose the power of service discovery... as the list is static. The other way would be to get the info by linking the Whisperer to the Docker socket... But this is a security risk, and would tie to much to Docker.

Localhost IPs preloading

While at it, I added another environment variable : CONTAINER_NAME. When present:

  • The list of local container own IPs are preloaded in the DNS resolving mecanism with as hostname value the CONTAINER_NAME value.

Docker 18.09

Docker 18.09 includes a parameter when creating the Overlay network to deactivate this new NAT feature and be like before: --opt dsr

With this parameter active, Swarm behavior is back to before 18.06, and Spider works like a charm. But at the cost of scalability.

If scalability is a matter, while using Spider, the best is to move the cluster replica settings from VIP to DNSRR, and use a load balancer like Traefik ;) See my other post from today.

Change of API gateway / reverse proxy / ingress controller

· 2 min read

NGINX

Spider internal cluster gateway was until this week NGINX. However, NGINX was presenting various issues in current setup:

  • In order to absorb scaling up and down of replicas, I was asking NGINX to resolve the IP of the services VIP on every call. DNS resolver had a cache of 30s.
  • The main issue was that NGINX can't do persistent connections to the upstreams in this case.
  • This made NGINX create a new TCP socket for every request. But soon enough when all TCP sockets were booked, it implied an increase of response time of 1 or 2s for linux to recycle sockets.

Change was needed!

Traefik

Traefik is more and more used as a gateway for Docker clusters (and others). It is indeed designed to integrate with Docker and to keep updated with cluster state.

So I switched Spider to Traefik this week. And the results are ... astonishing !!

Although the response time from the clients have not changed much, the response time internal to the cluster have improved of 80% !!

Note: I only struggled with Traefik configuration on Path rewriting.  It has less options than NGINX on this field. I had to add some custom rerouting inside the UIs themselves.

U/X change for Whisperers selection and config access

· One min read

After much use and comments, the way Whisperers were selected on the UI needed improvements.

  • We are always working with more than one Whisperers in our distributed systems
  • Then, having to click ctrl or shift to select them were painful
  • Moreover, having to get to one Whisperer only to edit its config was also painful. Too many clicks.

So I decided to change:

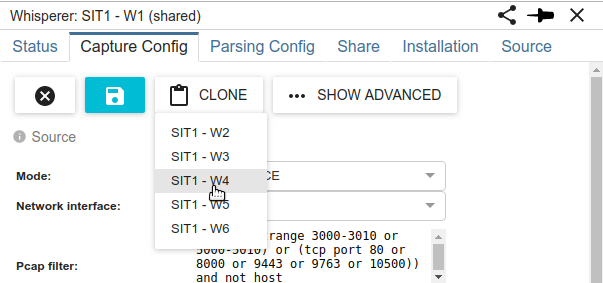
  • Whisperers selection is now acting as a real checkbox
  • You may use ctrl or shift while clicking to select only one
    • It then works better on my tablet ;-)
  • And from the Whisperer selection drop down, icons are now giving direct access to its status tab and to its config tab.
  • Consequently, the Whisperer config button has been removed from the main menu.

Isn't it neat? Small changes that make life easier :-)

New Goto Now feature, and improvements in timeline.

· One min read

Goto Now

On special request from Michal D., you may now click on the icon below to move the selection and timeline to current time. It is even more easier to troubleshoot your current work :-)

Improvements on timeline

I took the benefit, while I was working on it to improve timeline U/X:

  • When shifting / dragging the timeline while you were zoomed in, the higher zoom levels are updated (shifted) as well so that you don't feel lost when zooming out.
  • When moving selection outside current domain of timeline, the timeline shifts
    • Thus, the timeline will stay up-to-date with Step backward and Step forward actions.

Bugfixes

I solved a bug on race conditions when updating timeline and grid. This should fix the few cases when the grid / timeline were not updated.

Monitoring - UI usage dashboard

· 3 min read

Description

This dashboard provides statistics on Spider UI usage: Connected client over time, Usage statistics, Users statistics, Session history and Actions usage.

This dashboard has a different timescale as the others. Indeed, the UI tracking records are not purged at the same time as all other operational data. You can choose on the time scale to display:

  • Actions
  • Sessions
  • Jobs (purges & uploads)

Screenshot

Content

Simultaneous sessions over time (chart)

  • Tracks number of simultaneous connected users using on Spider UI over time
  • X axis: days
  • Y axis: hours

Actions per session distribution (chart)

  • Show distribution of count of actions per sessions

Network view usage stats (chart)

  • Show usage time statistics of Spider UI Views (HTTP, TCP, Packet) and Mode (Stats, Sequence diagram, Stats)

Self Monitoring usage stats (chart)

  • Show usage time statistics of monitoring views.

NetworkView options stats (chart)

  • Show options usage of NetworkView

Most used actions (chart)

  • Show most used actions in the UI

Most used Whisperers groups (chart)

  • Show most used Whisperers groups (by time)
    • By grouping them on their first 4 characters

User stats (grid)

  • Lists each users usage statistics of the UI over the selected period
    • Total actions
    • Total duration of sessions
    • Total hours of usage (each hour started counts)
    • Total count of days of usage
    • % of working day usage (sundays and saturdays are removed from reference)
    • Last usage date and time

Session items (grid)

  • Lists users sessions items
  • Preconfigured to display
    • Start time of session
    • Application
    • User
    • Duration of session
    • Active hours
    • Browser reloads count
    • Actions count
    • % spent on each view
    • % spent on each mode/subview
    • % spent on each options
  • Common Spider features on grid:
    • Allows opening the status record in the detail panel
    • Allows comparing items
    • Full integrated search using ES querystring with autocompletion and color syntaxing
    • Many fields to display / hide
    • Sorting on columns
    • Infinite scroll

Upload and purge items (grid)

  • Lists frontend / backend jobs triggered by users
    • Purges
    • Uploads (Pcap and Json export)
  • Preconfigured to display
    • Date of creation
    • Job type
    • Whisperer used
    • Status of action
    • Progress
    • Duration of job
  • Common Spider features on grid:
    • Allows opening the status record in the detail panel
    • Allows comparing items
    • Full integrated search using ES querystring with autocompletion and color syntaxing
    • Many fields to display / hide
    • Sorting on columns
    • Infinite scroll

Monitoring - Whisperers status dashboard

· 5 min read

Description

This dashboard provides a status of Whisperers clients: state, uploaded data, quality of parsing, cpu, ram, queues, circuit breakers…

Screenshot

Content

Whisperer status (chart)

  • Tracks status of all Whisperers connected to the server:
    • Starting
    • Recording
    • Stopped
    • Invalid_Config
    • Internal_Error
    • Server_Down (when they can't get configuration)

Whisperer uploads to server (chart)

  • Tracks data uploaded from the Whisperer to the server, in MB

Whisperers current status (grid)

  • Lists current session status sent by all Whisperers
    • Whisperer start, host monitored and uptime
    • Session start and duration
    • CPU, RAM
    • Payload sent and errors
  • Common Spider features on grid:
    • Allows opening the status record in the detail panel
    • Allows comparing items
    • Full integrated search using ES querystring with autocompletion and color syntaxing
    • Many fields to display / hide
    • Sorting on columns
    • Infinite scroll

Whisperers config and parsing status (grid)

  • Lists Whisperers and their parsing status over the selected period
    • Sent sessions, amount and percentage of parsing errors
    • Parsed Http communications and missing part
  • Common Spider features on grid:
    • Allows comparing items (config and stats merged)
    • Full integrated search using ES querystring with autocompletion and color syntaxing
      • Only on Whisperer config
    • Many fields to display / hide
    • Sorting on columns (from config)

Whisperer CPU usage (chart)

  • Tracks status CPU usage of all connected Whisperers
  • Should be low ;)
  • The more packets captured and parsed, the more CPU usage.
    • Captured packets can be limited by PCAP filter
    • Parsed packets can be limited by Hostname blacklisting in configuration
    • A circuit breaker on CPU usage can be set to pause Whisperers when too high load
  • Classic usage: between 3 and 10%

Whisperer used RAM (chart)

  • Tracks status RAM usage of all connected Whisperers
  • Classic usage:
    • 115 MB when capturing and server responding
    • 50 MB when stopped

Whisperer queue length (chart)

  • Tracks size of sending queue of Whisperers
    • Packets and Tcpsessions
  • When a Whisperer has too many requests to send to server, they are pushed to a queue, waiting for next slot to be sent.
  • When items are in the queue, it means either:
    • The server is getting slow and has issues
    • The Whisperer is under high pressure of packets to capture

Queues overflow (chart)

  • Tracks size of queues overflow
    • Packets and Tcpsessions
  • When a Whisperer has too many requests to send to server, they are pushed to a queue, waiting for next slot to be sent.
  • When the queue is full, oldest items in queues are discarded and never sent.
    • This causes parsing issues and missing data (not sent)
  • It shouldn't happen if the Whisperers and Servers are correctly scaled ;)

Active circuit breakers (chart)

  • Tracks when Whisperers have active circuit breakers
  • When a Whisperer cannot connect to the server, or fails sending data (time out, mostly), a circuit breaker opens, and the Whisperer stops trying for some time.
    • Data is lost
  • This can happen when:
    • CPU on the host the Whisperer is in is heavy loaded
    • Server is not scaled big enough
    • Server is partially down
      • When server is completely down, the Whisperer stops its capture and waits for it to get back up again

Whisperers status items (grid)

  • Lists all status sent by Whisperers
  • Items are pre filtered on those having errors
  • Common Spider features on grid:
    • Allows opening the status record in the detail panel
    • Allows comparing items
    • Full integrated search using ES querystring with autocompletion and color syntaxing
    • Many fields to display / hide
    • Sorting on columns
    • Infinite scroll

Hosts items (grid)

  • Lists hosts resources of Whisperers
  • Hosts resources tracks the name resolving of Hosts seen by Whisperers
    • Start and stop of capture for each host
    • Dns names
    • Custom names set by users on UI or by parsing configuration
    • Position on map (if fixed)
  • An host resource is updated at regular interval, and a new one is created only when an host changes IP or Dns name
  • Common Spider features on grid
    • Allows opening the host record in the detail panel
    • Allows comparing items
    • Full integrated search using ES querystring with autocompletion and color syntaxing
    • Many fields to display / hide
    • Sorting on columns
    • Infinite scroll

Hosts stats (grid)

  • Perform statistic on Hosts resources for each Whisperer over the period
  • If, over a couple of hours, a Whisperer has too many Hosts records, with a very short average duration, it means that:
    • Names of hosts is not stable
      • For instance Docker Swarm has a bug in reverse DNS of hosts. Often, the id of the Docker is returned instead of the name of the service replica.
      • This can be worked around with Whisperers settings
    • Name resolving of IPs on the UI may fail
      • The UI limit its load to 99 Hosts resources at once.
  • Grid has limited features: only display.

Monitoring - Applicative cluster status dashboard

· 3 min read

Description

This dashboard provides a status of the applicative processing of Spider: speed, quality of parsing, circuit breakers, logs...

Screenshot

Content

Processing speed (chart)

  • Evolution of input speed from Whisperers per min.
  • Packets and Tcp inputs
  • Http output

Tcp parsing status (chart)

  • Quality of parsing, listing the different status: Waiting, Pending, Ok, Warning, Error
  • The less red, the better ! :)
  • Errors could have many factors, but mainly: CPU contention on clients or servers

Service Speed from Whisperers (chart)

  • Response time of the servers endpoints, as seen from the Whisperers client
  • The lower the better
  • If too big, more server nodes and service replicas are needed

Service Speed between apps (chart)

  • Response time between nodes in the cluster
  • The lower the better
  • The most stable the better
  • If too big, more server nodes and service replicas are needed

Polling queued (chart)

  • Count of items in Redis queues, waiting for serialization in ES
  • The most stable the better
  • If increasing, more pollers replicas are needed, or more ES indexation power

Active circuit breakers (chart)

  • Count of opened circuit breakers on communications between services (not to the stores)
  • Nothing on the graph is the target

Circuit breakers items (grid)

  • List circuit breakers status over the period
  • Preconfigured to display only those between applications, and with errors
  • Common Spider features on grid:
    • Allows opening the status record in the detail panel
    • Allows comparing items
    • Full integrated search using ES querystring with autocompletion and color syntaxing
    • Many fields to display / hide
    • Sorting on columns
    • Infinite scroll

Errors and Warnings in logs (charts)

  • Count of errors in logs, grouped by service
  • Count of warnings in logs, grouped by service
  • No items is the target

Log items (grid)

  • List logs over the period
  • Preconfigured to display only those of Warning or Error levels
  • Common Spider features on grid:
    • Allows opening the logs in the detail panel
    • Allows comparing items
    • Full integrated search using ES querystring with autocompletion and color syntaxing
    • Many fields to display / hide
    • Sorting on columns
    • Infinite scroll
  • Hyperlinks to Spider objects, depending of what is linked in the logs:
    • Whisperers configurations
    • TcpSessions
    • HttpCommunications
    • Customers
    • Packets
    • and so on...
  • Open logs in a specific detail panel with hyperlinks.

Monitoring - Datastores status dashboard

· 3 min read

Description

This dashboard provides a status of Elasticsearch and Redis datastores: response time, speed, size, and circuit breakers

Screenshot

Content

Redis response times (chart)

  • Tracks the response times of services and pollers calling Redis
  • ... Redis is sooo fast!

Elasticsearch response times (chart)

  • Tracks the response time of services and pollers calling Elasticsearch
  • Times are much longer than Redis but should stay below 1s
  • Most long times are Pollers saving data

Redis content (chart)

  • Tracks the evolution of data content in Redis memory
  • Must be stable

Elasticsearch content (chart)

  • Track the evolution of data in Elasticsearch
  • Always goes up, except when purging ;-)

Redis size (chart)

  • Tracks the memory usage of Redis
  • See servers status for more info

Elasticsearch size (chart)

  • Tracks the size of Elasticsearch indices (aggregated for time based indices)

Elasticsearch CPU load spread over indices (chart)

  • Tracks the CPU usage of Elasticsearch spreaded over its indices
  • Strange that indexing seems low CPU... to be checked
  • Allows to see unexpected patterns

Elasticsearch index speed (chart)

  • Track indexing speed on each index
  • Confirms processing speed of applicative cluster
    • Nb: many packets are not saved in ES to save space

Elasticsearch get speed (chart)

  • Tracks Elasticsearch direct document access (get)
  • Almost absent in Spider thanks to cache optimisations
  • This chart allowed to track those usages and effectively optimise them ;)

Elasticsearch search speed (chart)

  • Tracks Elasticsearch searches
  • Almost absent in Spider thanks to cache optimisations
  • This chart allowed to track those usages and effectively optimise them ;)
  • Searches are almost only used by UIs

Active circuit breakers on Redis and ES (chart)

  • Tracks opened circuit breakers between services, pollers and Elasticsearch/Redis
  • Very often CB are opening on pollers when ES cluster is too small sized...
    • But pollers retry, so this is not an issue.
    • It can be checked in logs, listing all items not saved... but that you can still open in Monitoring UI, because they were eventually saved.

Circuit breakers items (grid)

  • Lists circuit breakers status over the period
  • Preconfigured to display only those between applications and datastores, and with errors
  • Common Spider features on grid:
    • Allows opening the status record in the detail panel
    • Allows comparing items
    • Full integrated search using ES querystring with autocompletion and color syntaxing
    • Many fields to display / hide
    • Sorting on columns
    • Infinite scroll

Monitoring - Servers status dashboard

· 3 min read

Description

This dashboard provides a status of the servers hosting the cluster and its datastores: CPU, RAM…

Screenshot

Content

Applicative nodes CPU usage (chart)

  • CPU usage of each node involved in the applicative cluster
  • Can be above 100% when multiple cores
  • Stability is key
  • Same usage on each nodes is preferred
  • Target is below 75% * number of cores

Applicative nodes free RAM (chart)

  • Free RAM usage of each node involved in the applicative cluster
  • This include the caching, so could be rather low
  • Stability is better
  • Same usage on each nodes is preferred

Services CPU usage (chart)

  • Sum of all CPU usage of all replicas for each service
  • Allow to find most demanding services easily and scale them
  • Allow to track weird behaviors
  • We can see that the most used ones are:
    • PackWrite that receives and parse Packets from Whisperers
    • WebWrite that aggregates packets of a TCP session to parse it
    • PackRead that gives packets to Webwrite
    • TcpUpdate that updates TCP sessions
    • TcpWrite that receives TCP sessions from Whisperers

Services average RAM usage (chart)

  • Track the average RAM usage of all replicas for each service
  • Stability is the target
  • There is currently an issue with MonitorWrite memory. Yet to be fixed.

Redis CPU usage (chart)

  • Track the CPU usage of Redis databases instances
  • Nothing special to say... it is so small!
  • The number of instances and what they hosts is configurable
  • Here:
    • Main: Tcp sessions, Http coms and Http pers
    • Pack: Packets, Status, Whisp status, Customers and Whisperers

Redis used RAM (chart)

  • Tracks the memory usage of Redis
  • When the processing of pollers and parsing is too slow, Redis accumulates data and can reach its maximum (1GB for default)

Elasticsearch CPU usage (chart)

  • Tracks the CPU usage of Elasticsearch inside each Node of Elasticsearch cluster
  • Maximum at 100%
  • Stability is a key

Elasticsearch heap used (chart)

  • Track the JVM Heap used  of Elasticsearch on each node
  • Should stay below the limit (each: 4GB - half the node memory)

Elasticsearch disk used (chart)

  • Track the disk used on each ES node
  • Should not reach the limit (here, 400 GB)