Before going public, I needed extended features in user account management:
- User needed to be able to reinitialize his password when he forgot it
- Without contacting the support
- With security and identity confirmation: getting a link by mail to enter a new password
- User needed to be able to change email in a secured way
- Since email is used for password recovery, changing mail must be secured by something stronger than current token
- User then needed to enter its password when changing email
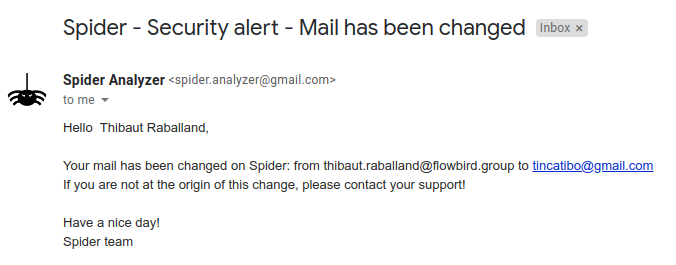
- User needed to be notified by mail when changing email or password
- Since email was getting very important, emails needed to be confirmed
- When setting an new email adress, user need to confirm the email by cliking on a link sent to him by email
- At user account creation, or email change
- Last but not least, a new user needs to be able to create its account with or without admin confirmation
First, I needed to create an email service.
This is a simple mail over REST service, integrated with a defined account.
- It can use SMTP, secured SMTP or Gmail account.
- It uses nodemailer library
- It integrates with gmail by OAuth tokens following these tips:
- API
Then I needed to define and develop the flows
Process is the following:
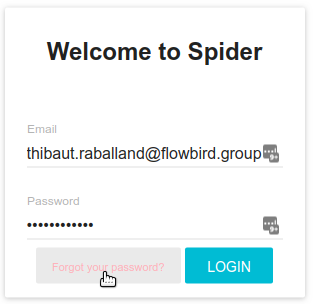
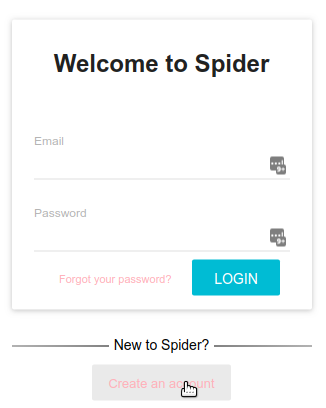
- On login screen, click on the password forgotten link, and enter your email adress
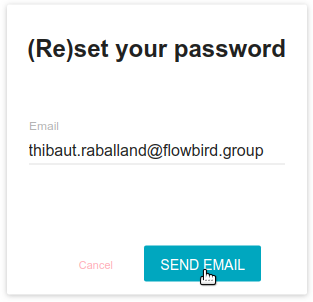
- A mail is sent to your adress (if the account exists) with a link to change your password
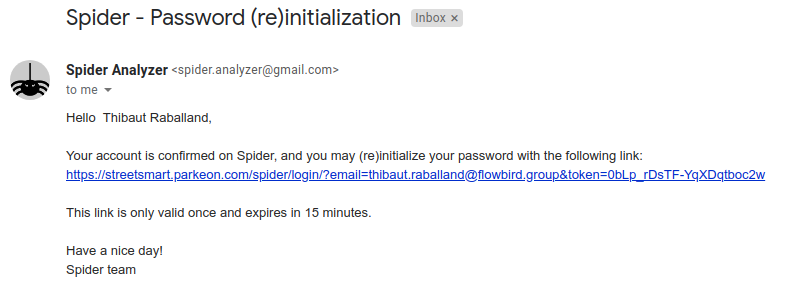
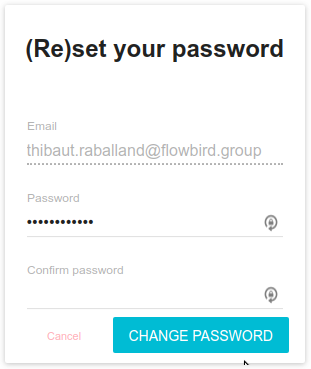
- The link opens a new window were you may set a new password The link has a limit in validity and won't work after a short period of time The link can only be used once
When changing email or password in profile edition tab, Spider is now requesting that you provide current password:

Then,
- If you change email
- An informative email is sent to previous mail to tell about mail change
-
- Another email is sent to new email address with a link to confirm new mail
- If you change password
- An informative email is sent to confirm change of password
At account creation, or at email change, an activation email is sent to user's email address to confirm his email:
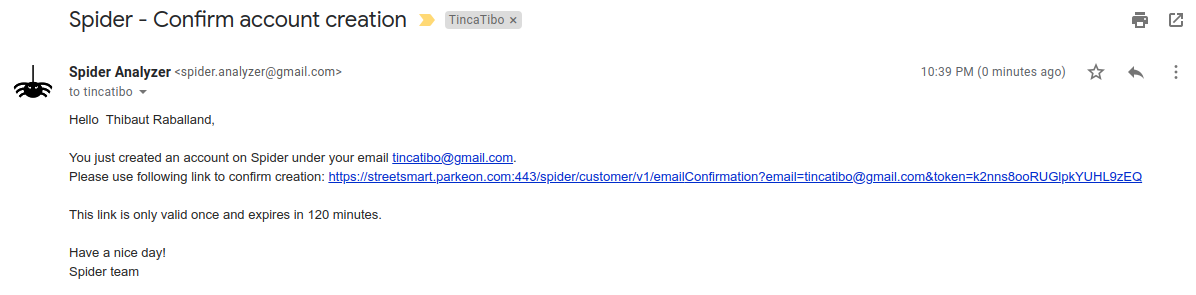
This email contains a link to confirm the new address. It is valid only once and for a limited time.
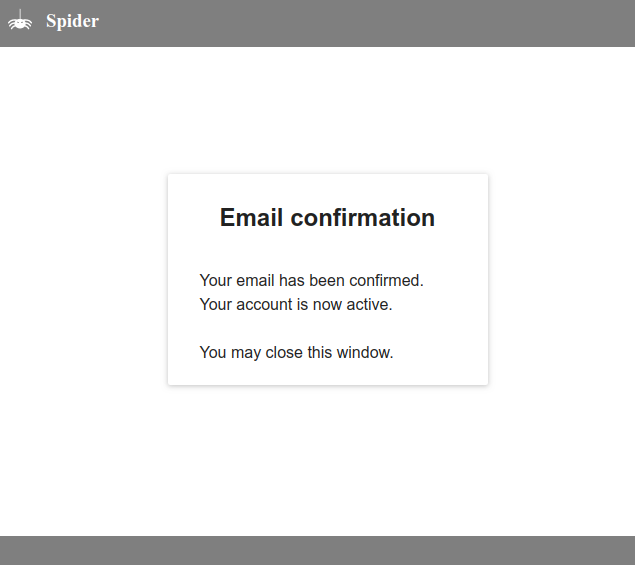
- Clicking on the link validates the email change.
- Not doing so on time... locks down the account, and only an administrator can unlock it.
A new user can now create an account from the login screen:
A creation form opens to input user details:
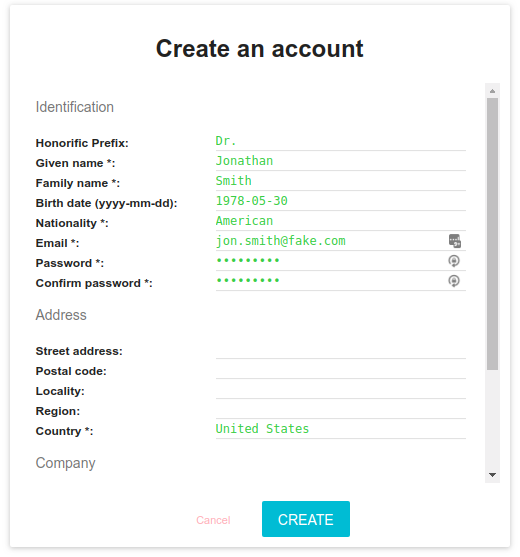
At the bottom of it, a comment input allows to give information for the administrator validating the account (if need be).
The new user will receive an email to confirm his email address.
Depending on platform settings, the account may need validation/activation by an administrator.
- The latter will then receive an email automatically, once the email is confirmed.
- He can also associates whisperers to the new account, if requested.


