Monitoring - Applicative cluster status dashboard
Description
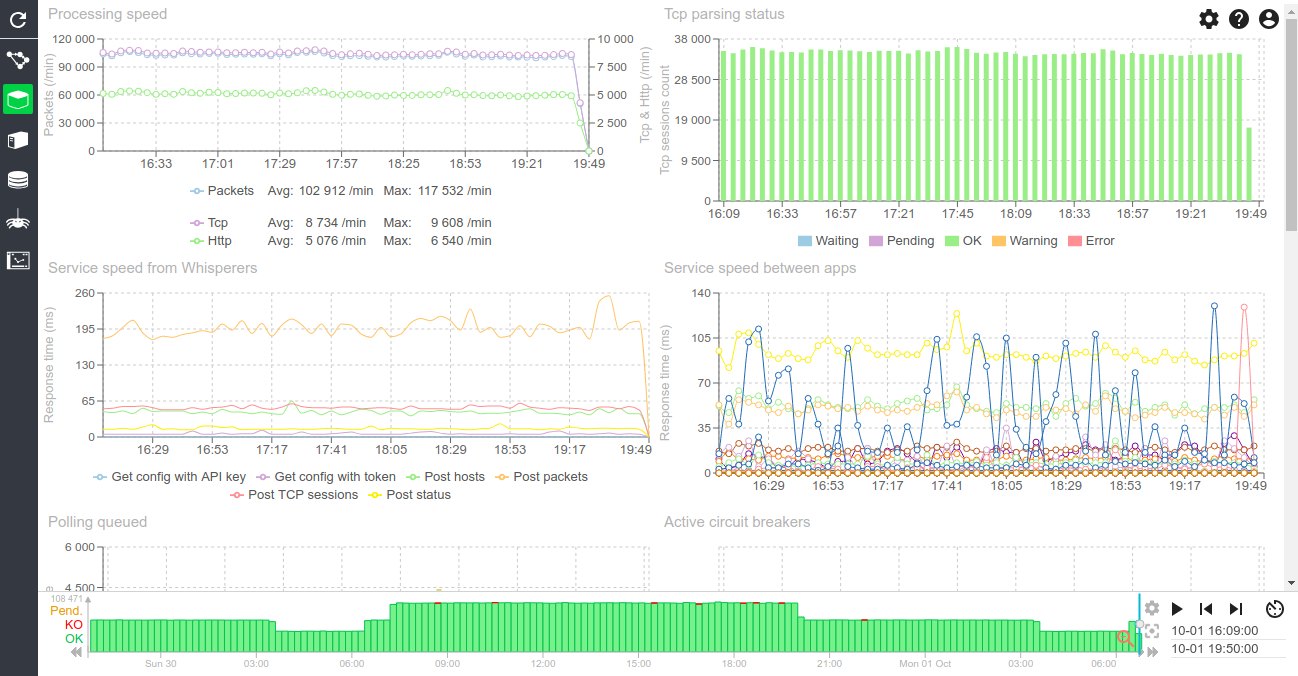
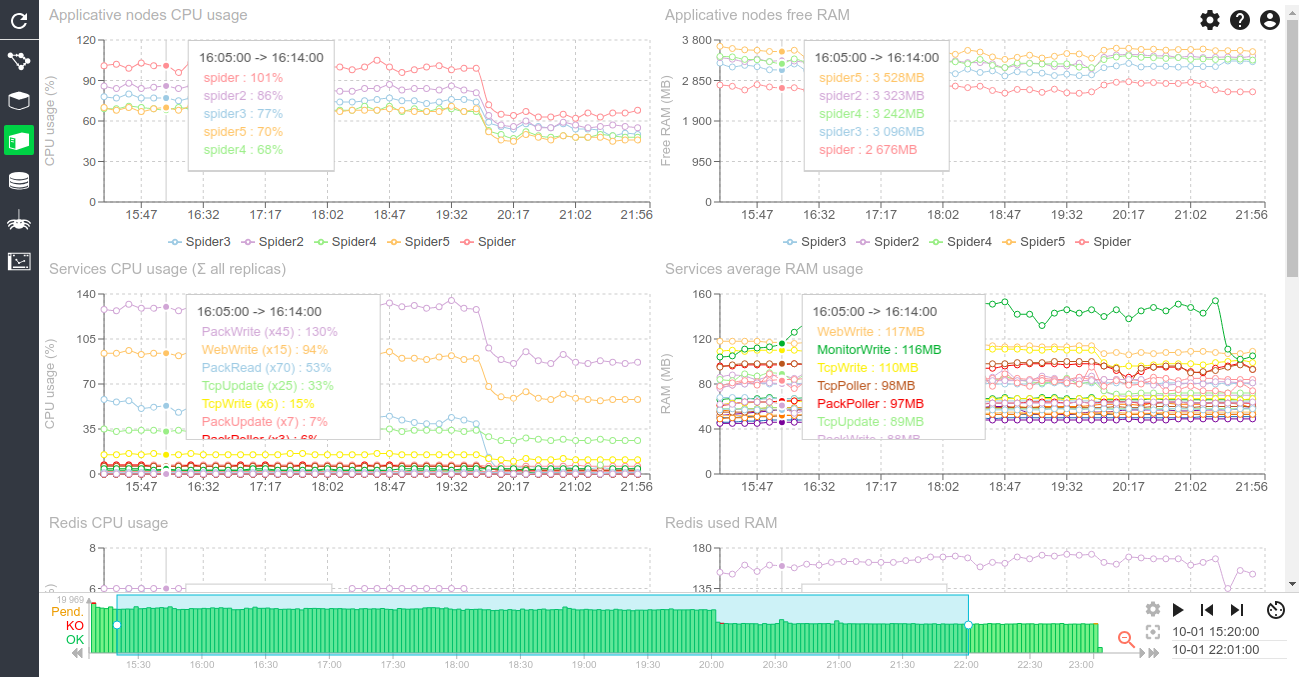
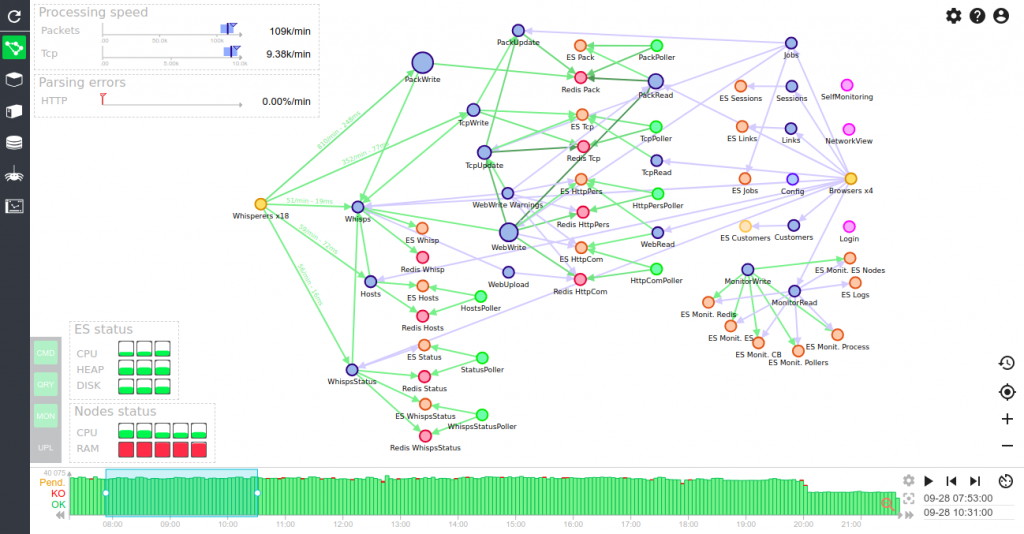
This dashboard provides a status of the applicative processing of Spider: speed, quality of parsing, circuit breakers, logs...
Screenshot
Content
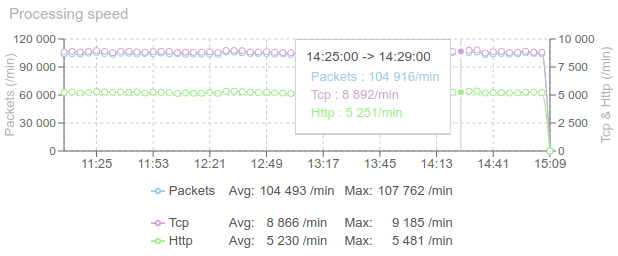
Processing speed (chart)
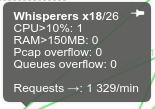
- Evolution of input speed from Whisperers per min.
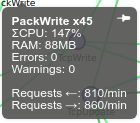
- Packets and Tcp inputs
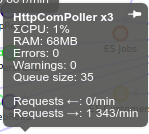
- Http output
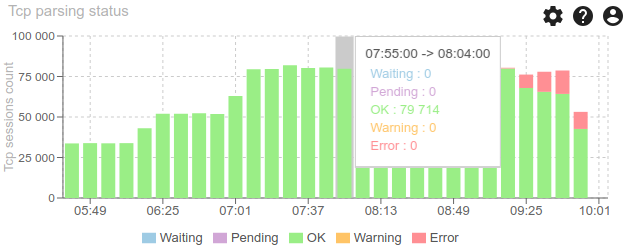
Tcp parsing status (chart)
- Quality of parsing, listing the different status: Waiting, Pending, Ok, Warning, Error
- The less red, the better ! :)
- Errors could have many factors, but mainly: CPU contention on clients or servers
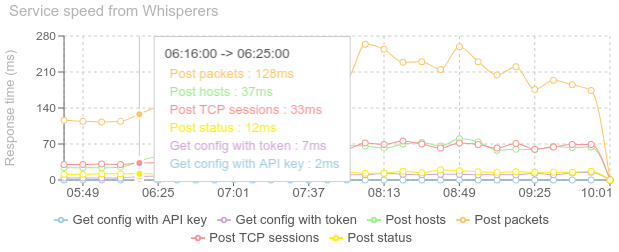
Service Speed from Whisperers (chart)
- Response time of the servers endpoints, as seen from the Whisperers client
- The lower the better
- If too big, more server nodes and service replicas are needed
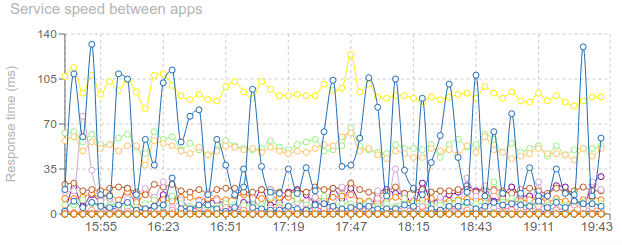
Service Speed between apps (chart)
- Response time between nodes in the cluster
- The lower the better
- The most stable the better
- If too big, more server nodes and service replicas are needed
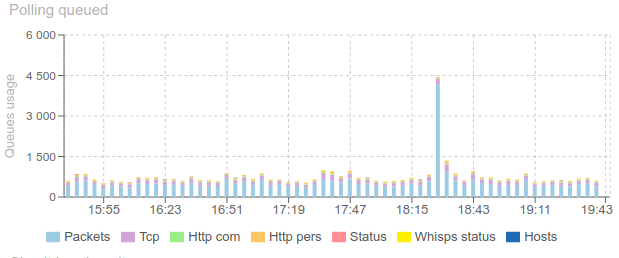
Polling queued (chart)
- Count of items in Redis queues, waiting for serialization in ES
- The most stable the better
- If increasing, more pollers replicas are needed, or more ES indexation power
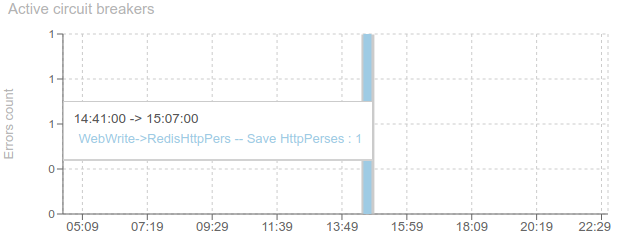
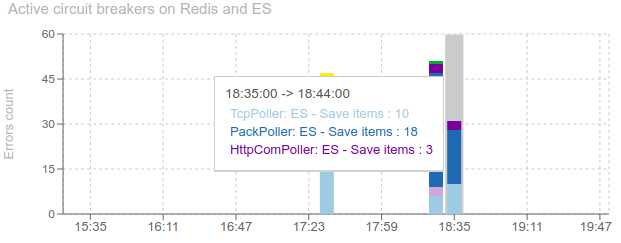
Active circuit breakers (chart)
- Count of opened circuit breakers on communications between services (not to the stores)
- Nothing on the graph is the target
Circuit breakers items (grid)
- List circuit breakers status over the period
- Preconfigured to display only those between applications, and with errors
- Common Spider features on grid:
- Allows opening the status record in the detail panel
- Allows comparing items
- Full integrated search using ES querystring with autocompletion and color syntaxing
- Many fields to display / hide
- Sorting on columns
- Infinite scroll
Errors and Warnings in logs (charts)
- Count of errors in logs, grouped by service
- Count of warnings in logs, grouped by service
- No items is the target
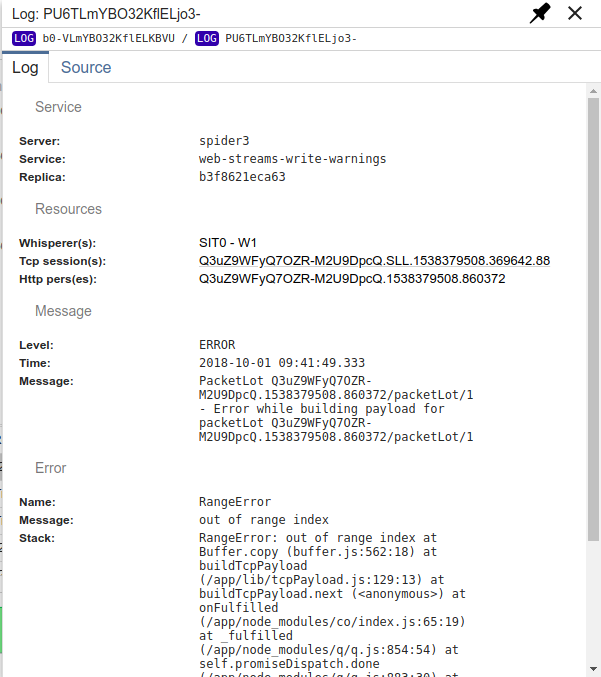
Log items (grid)
- List logs over the period
- Preconfigured to display only those of Warning or Error levels
- Common Spider features on grid:
- Allows opening the logs in the detail panel
- Allows comparing items
- Full integrated search using ES querystring with autocompletion and color syntaxing
- Many fields to display / hide
- Sorting on columns
- Infinite scroll
- Hyperlinks to Spider objects, depending of what is linked in the logs:
- Whisperers configurations
- TcpSessions
- HttpCommunications
- Customers
- Packets
- and so on...
- Open logs in a specific detail panel with hyperlinks.
