65 posts tagged with "architecture"

View All Tags

Manage secured Elasticsearch

· One min read

With new Elasticsearch releases: 8 and on, security is active by default on the cluster:

  • User authentication
  • TLS with mutual auth between Elasticsearch nodes

In order to be ready to use it, I upgraded all microservices using Elasticsearch to support all authentication methodes supported by ES Javascript client. Everything is managed by the central setup, that expect Elasticsearch setup to required authentication.

TLS may also be used to connect to Elasticsearch, with self signed certificates if needed.

New parameter to protect against too big packetLots

· One min read

Too protect servers and UI against communications that would be too big, a new protection exists:

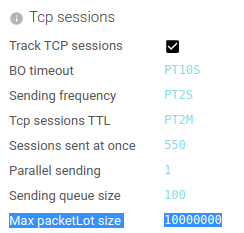
When a TCP packetLot gets over a certain limit, the packets are marked as plTooBig to be then avoided in parsing.

  • Packet flag is shown on Packet details
  • Packet is colored in grey in TCP details
  • Parsed communications are market as INCOMPLETE (since they miss packets), and capture status reflects the errors in parsing

This avoids loading too many subsequent packets in memory for parsing. Default value is set to 10 MB. Which should be quite enough.

Associated Whisperer version is 5.1.0.

Another scaling limiting feature removed :)

· One min read

When too many TCP sessions or HTTP communications are parsed in the same minute, their count could overflow Node.js or Redis capabilities to manage in a single call.

I couldn't see it before since I had to scale parsing services with many more instances that now. Now parsing services are more efficient. They can handle much more load by each single replica, but then, they reach a limit in scaling!

After much study and not finding a way to simplify the data sent, I decided to... chunk the calls in pieces ;) Simple solution =)

So now, big loads do not generate errors and are absorb quite smoothly.

Last statistics are showing that Spider processes 400 MB/min with only 8 CPU cores fully used :) Nice!

How does Spider cope with an 2x load for 15 min?

· 3 min read

Today, checking monitoring at the end of day, I found a spike of 'parsing errors' in the morning. The monitoring helped me find out why. take the path with me:

1 - Looking at the logs dashboard 

We can see a spike in logs - nearly 6000!! - around 10:13. The aggregation by codes show us very easily that there have been parsing issues, and when opening the log detail, because there were missing packets.

Let's find the root cause.

2- Looking at the parsing dashboard
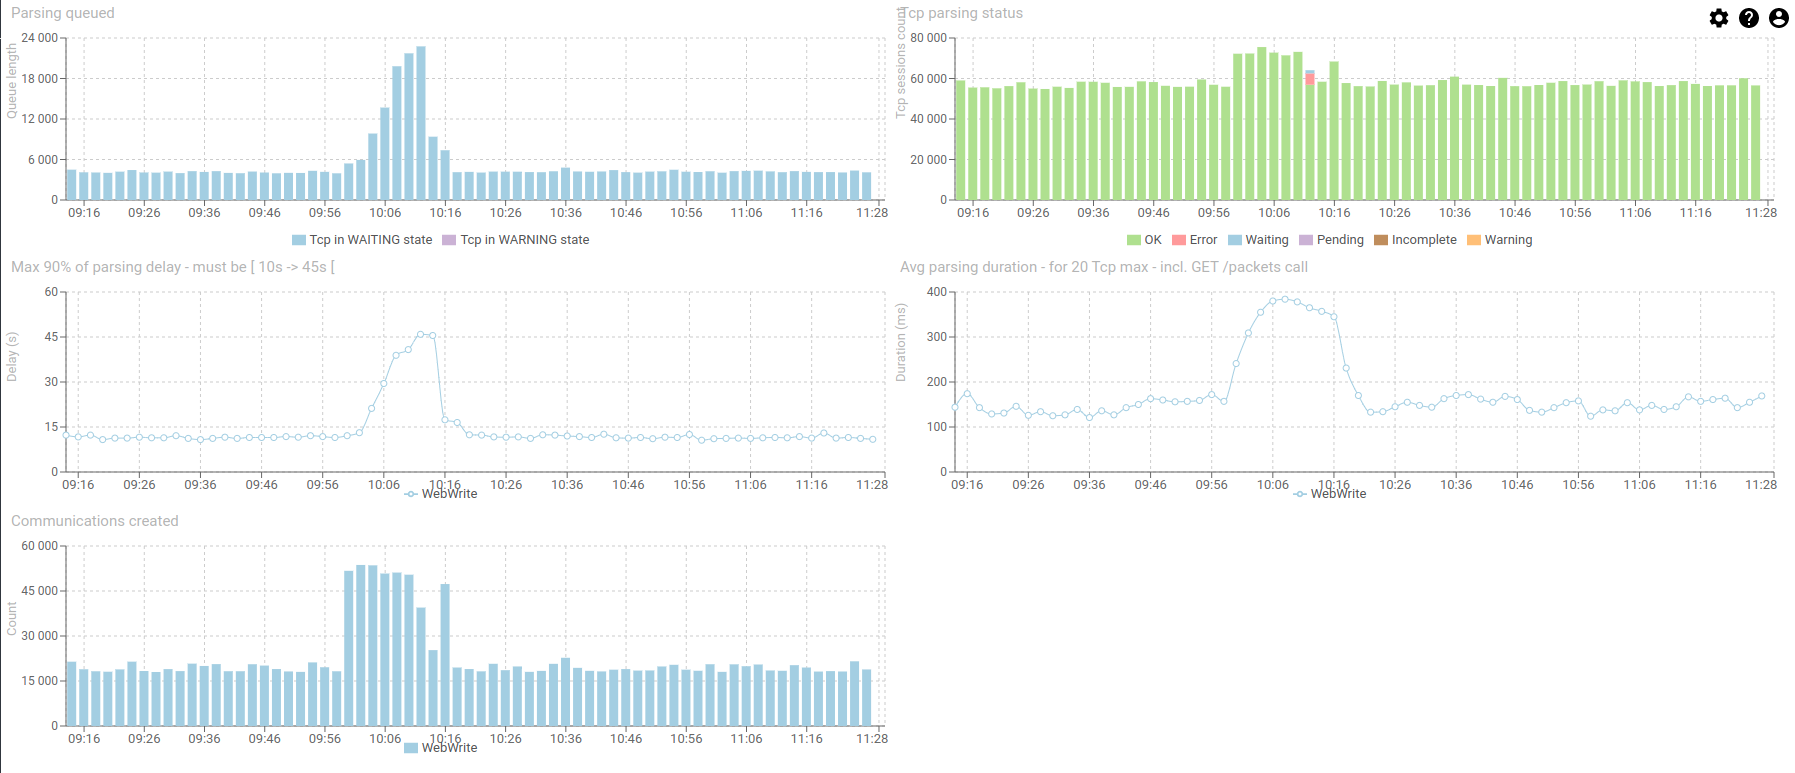
We can see an increase of Tcp session in waiting to be parsed in the queue, and the parsing duration and delay increasing.

Many HTTP coms were still created, so there is no like, errors, but only in increase of demand.

There is a small red part of the Parsing status histogram, with 5603 sessions in errors out of 56000.

3- Further on, in the services dashboard

There is definitely an increase of input load, and an even more increase of created Http Coms. The input load almost doubled in size!

CPU is still good, with a net increase of parsing service.

4- Looking at DB status

Redis doubled its load, with a high increase in RAM, but it came back to normal straight after :) Works like a charm!
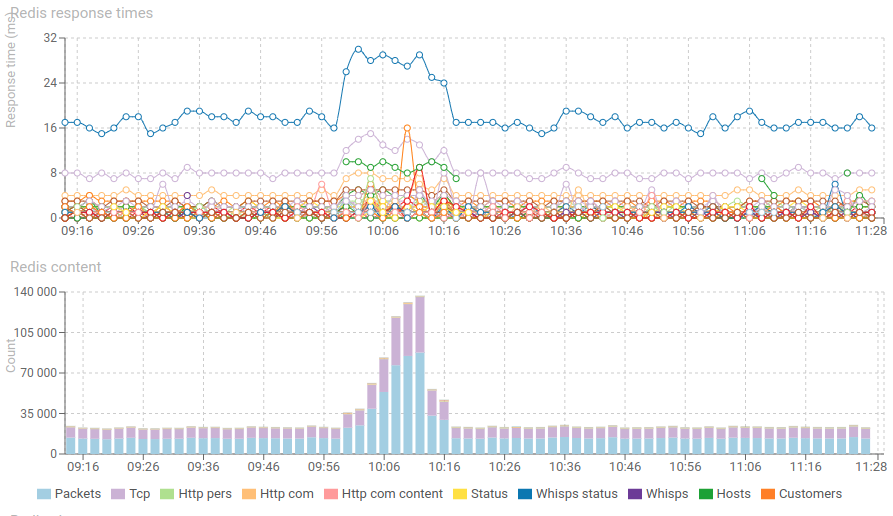
Response time and content of Redis increase significantly but nothing worrying. The spike has been absorbed.

Elasticsearch shows a net increase of new communications indexation.

5- Then the whisperers dashboard gives us the answer

In fact, all was normal, it's only the performance team (SPT1 whisperer) that decided to capture one of their test :-)


That's good observability capabilities, don't you think? All in all, everything when well.

  • The spike was absorbed for almost 15 minutes,
  • But the parsing replicas where not enough to cope with the input load, and the delay of parsing increased regularly
  • So much that Redis started removing data before it got parsed (when the parsing delay reached 45s, the TTL of packets)
    • Watch again the second set of diagrams to check this.
  • Then the parsers started complaining about missing packets when parsing the Tcp sessions. The system was in 'security' mode, avoiding to crash and avoiding the load increase.
  • All went back to normal after SPT1 stopped testing.

The system works well :) Yeah! Thank you for the improvised test, performance team !

We may also deduced from this event that parsing service replicas may be increased safely to absorb the spike. As the CPU usage still offered room for it. Auto scaling would be the best in this case.

Cheers, Thibaut
Parsing engine rework !

· 4 min read

Existing issue

The existing parsing engine of Spider had two major issues:

  • Tcp sessions resources were including the list of packets they were built from. This was a limitation in the count of packets a tcp session could hold because the resource was ever increasing. And long persistent Tcp sessions were causing issues and thus were limited in terms of packets.
  • Http parsing logs were including as well list of packets and of HTTP communications found.

I studied how to remove these limitations, and how to improve at the same time the parsing speed and its footprint. While keeping the same quality of course!

And I managed :) !!

I had to change part of architecture level 1 decisions I took at the beginning, and it had impacts on Whisperers code on 7 other micro services, but it seemed sound and the right decision!

Work

4 weeks later, it is all done, full regression tested and deployed on Streetsmart! And the result is AWESOME :-)

Spider now parses Tcp sessions in streaming, with a minimal footprint, and a reduced CPU usage of the servers for the same load ! :)

I also took the time to improve the 'understandability' of the process and the code quality. I will document the former soon.

Results

Users... did not see any improvements (nor any issue), except that 'it seems faster', but figures are here to tell us!

The first day, I achieved 65 parsing errors out of 43 million communications! Those 2 missed bugs were solved straight away thanks to good observability! :)

Effects on back end

3 /v2 APIs have been added to the API. Corresponding /v1 APIs will be deprecated soon.

But Spider is compatible with both, which allowed me an easy non regression by comparing parsing results of the same network communications... by both engines ;-) !

Effects on UI

  1. Grids and details view of packets and Tcp sessions have been updated.
  2. Pcap upload feature has been updated to match new APIs.
  3. Downloading pcap packets has been fixed to match the new APIs.
  4. All this also implied changes in Tcp sessions display:
  • Details and content details pages are now with infinite scroll as there may be tens or hundreds of thousands of packets.
    • It deservers another improvement for later: to be able to select the time in the timeline!
  • Getting all packets of a Tcp session is only a single filter away.

Performance

Last but not least... performance!! Give me the figures :)

Statistics over

  • 9h of run
  • 123 MB /min of parsed data
    • 318 000 packets /min
    • 31 000 tcp sessions /min
  • For a total of
    • 171 Million packets
    • 66,4 GB
    • 16 Million Tcp sessions
    • 0 error :-)

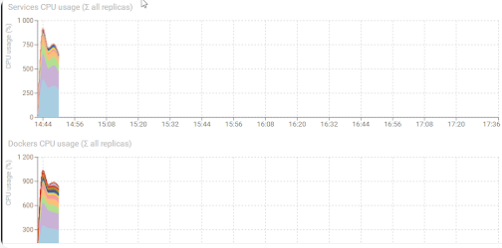
CPU usage dropped!

Before:After:

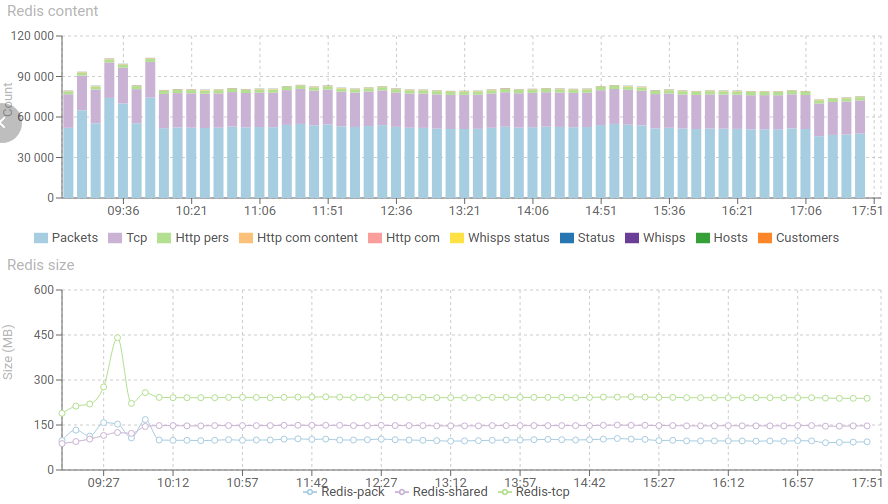
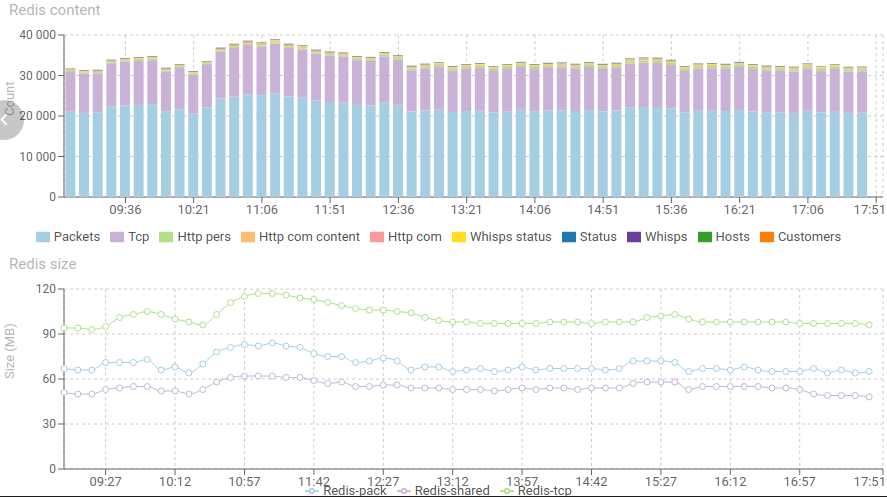
Redis footprint was divided by more than 2!

  • From 80 000 items in working memory to 30 000
  • From 500 MB to 200 MB memory footprint :)

Before:After:

Resource usage

CPU usage for parsing service dropped of 6%. But the most impressive is the CPU drop of 31% and 43% of inbound services: pack-write and tcp-write.

Whisperers --> Spider

Confirming the above figures, response time of pack-write and tcp-write as improved of 40% and 10%!

API stats

APIs statistics confirm the trend with service side improvements of up to 50%! Geez !!

Circuit breakers stats

When seen from the circuit breakers perspective, the difference is smaller, due to delay in client service internal processing.

Conclusion

That was big work! Many changes in many places. By Spider is now faster and better than ever :)

Excel driven refactoring ! My first ever ;)

· 2 min read

One of the oldest saga of Network UI was needing a huge refactor. Well... not a refactor, the goal was to remove it completely.

I made it before I built my best practices with Saga. And this method was one that help me understand... not to do like this ;) This method was called on various users and automatic actions to update various elements of the UIs:

  • Timeline
  • Map
  • Grid
  • Stats
  • Nodes names
  • ...

While it was updating everything, it was quite simple. But for performance improvements, and to limit the queries on the servers, many parameters were added to limit some refresh to some situations.

However, this is not the right pattern. It is better to have each component have its own saga watching the actions they would need to refresh on. This is the pattern I implemented almost everywhere else, and it scales good, while limiting the responsibility in one place.

To perform this refactor was risky. As the function was called from many places with various arguments.

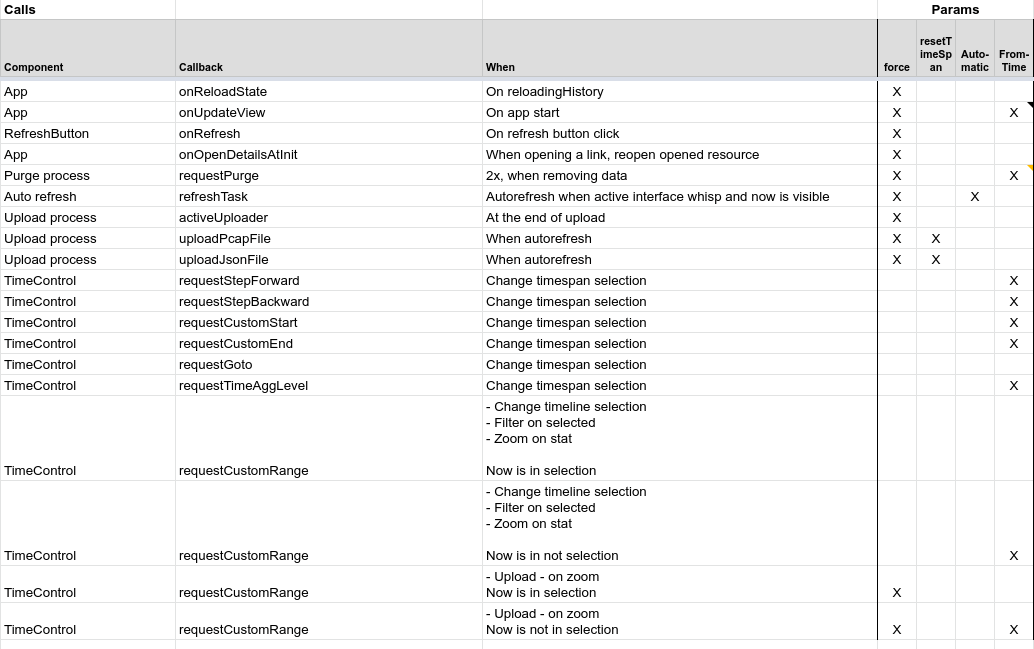
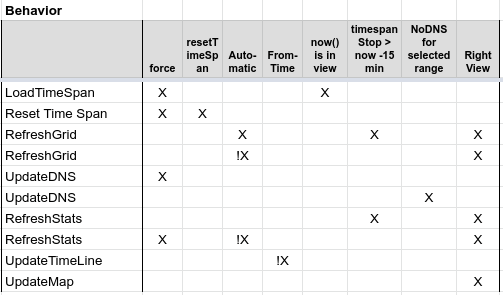
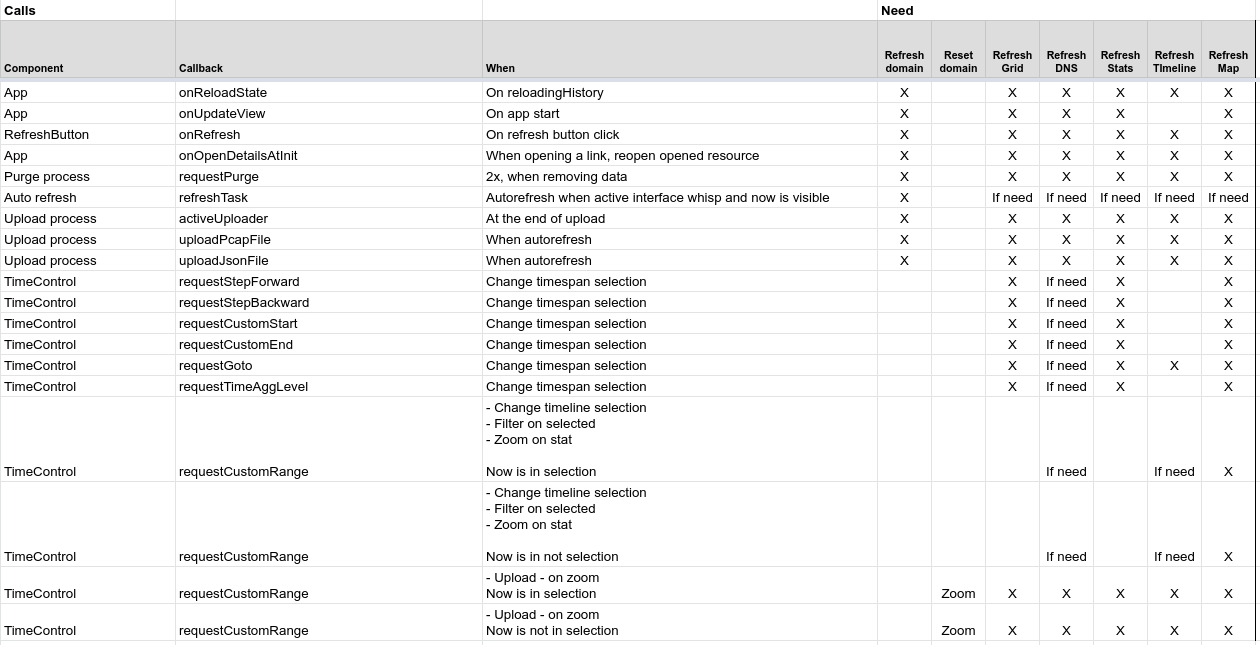
So I used ... Excel ! ;)

1. List the calls

2. List the behaviors from the params

3. List the needs for each call

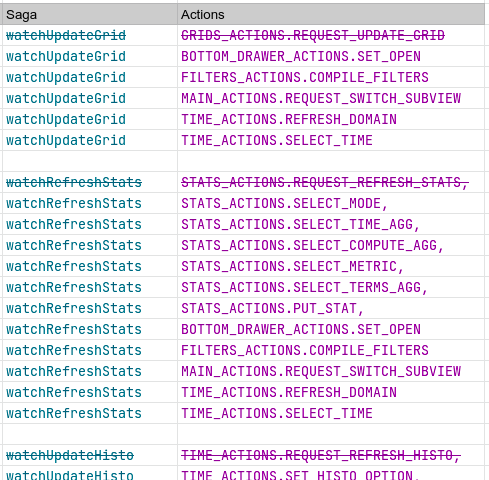
4. Find the actions behind each need, and subscribe the update sagas to those actions

5. Tests!!

All in all... 5h of preparation, 5h of refactor + fix and... it rocks :) !

So much more understandable and maintenance easy. What a relief to remove this old code.

Code are aging badly. Really ;)

Monitoring - New Performance view

· One min read

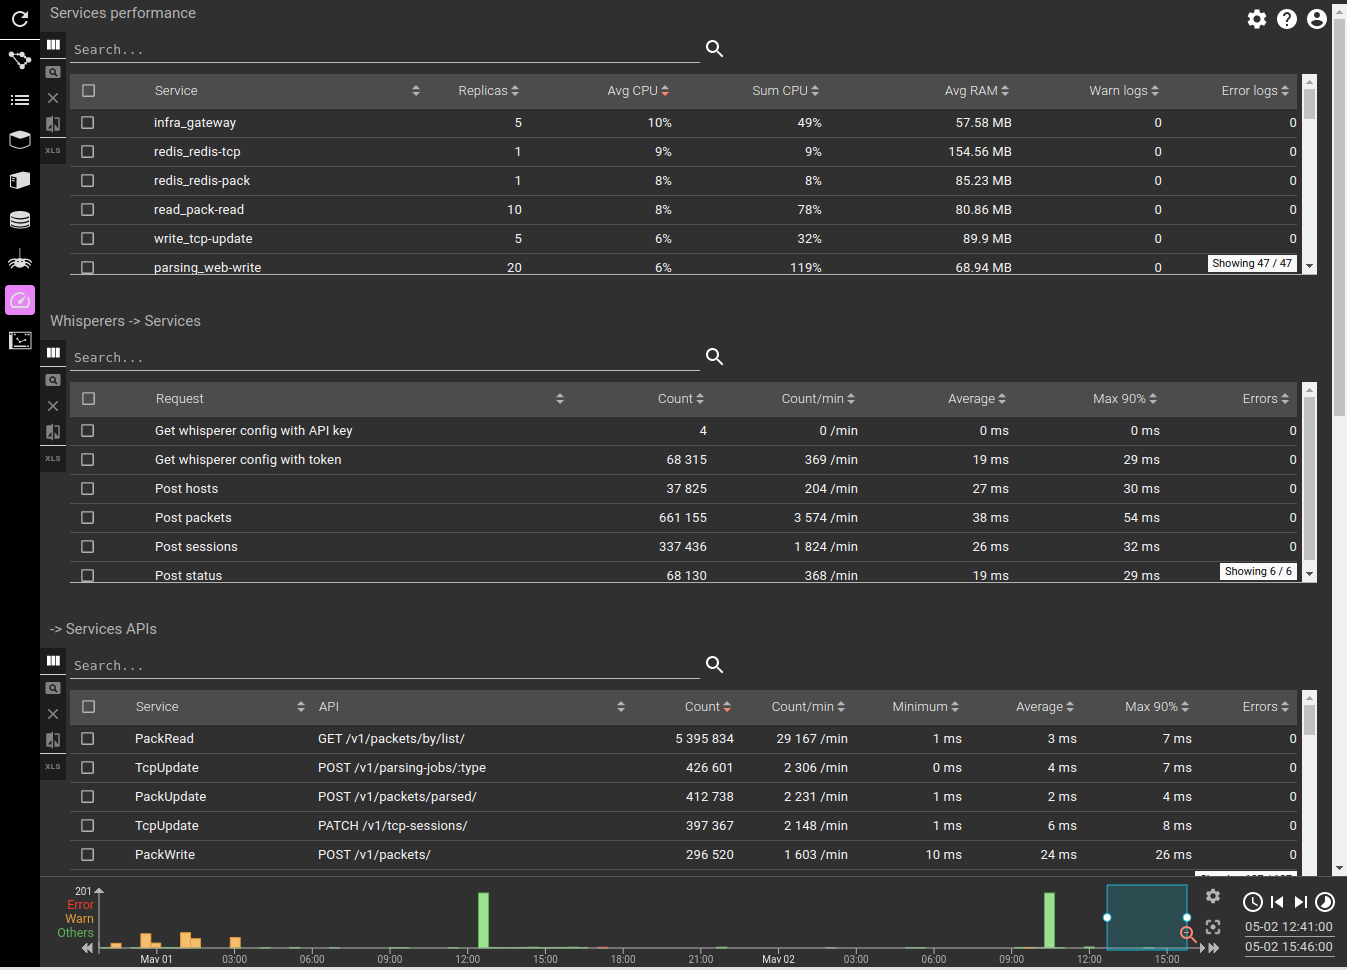
I added a new view to monitoring. And thanks to the big refactors of last year... this was bloody easy :)

This view adds several grids to get performance statistics over the period:

  • Services performance
    • Replicas, CPU, RAM, Errors
  • Whisperers -> Services communications
  • Services API
  • Services -> Services communications
  • Services -> Elasticsearch
  • Services -> Redis
    • For all: Load, Latency, Errors

Setup is managing Docker config upgrades

· One min read

I wanted to remove coupling between Spider setup and infrastructure configuration.

There was one sticky bit still: the configuration service was using a volume with all configuration files of the applications mounted from it.

I moved it all in Docker configs, so that you may have many replicas of configuration service, and also so that High Availability is managed by Docker. To be able to go towards this, I upgraded Spider setup script to:

  • Create Docker configs for each application configuration file
  • Inject them in Configuration service Docker stack definition
  • And also... manage updates of those configuration to transparently change the Docker configs on next deploy.

Now, more than ever, setup and upgrades of Spider are simple:

  • Setup your ES cluster
  • Setup your Docker Swarm cluster
  • Pull the Setup repo and configure setup.yml
  • To install:
    • Run make new-install config db keypair admin crons cluster
  • To update:
    • Run make update config db cluster

I could also manage Docker secret upgrades... but since only the signing key is in secret, there is not much value in it :)

Technical upgrades

· One min read

I did some technical upgrades of Spider:

  • Traefik -> 2.4.8
  • Redis -> Back in Docker Swarm cluster for easier upgrade, and High Availability
  • Metricbeat & Filebeat -> 7.11

I also tested Redis threaded IO... but there was no gain, so I reverted back.