Save password for Plugins
Previously, password type parameters in plugins were not saved in user settings.
Passwords were still saved in the local storage, but not sent to Spider backoffice.
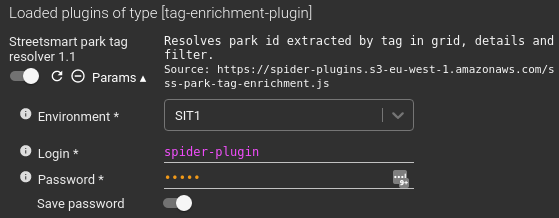
If the credentials used for the plugin are not so important and of no risk, you may choose to save them in Spider user settings. For this, switch the toggle below the password parameter in the plugins settings. Nothing special to do in the plugin manifest !
Timeline upgrade ! Better zoom out UX and tooltips!
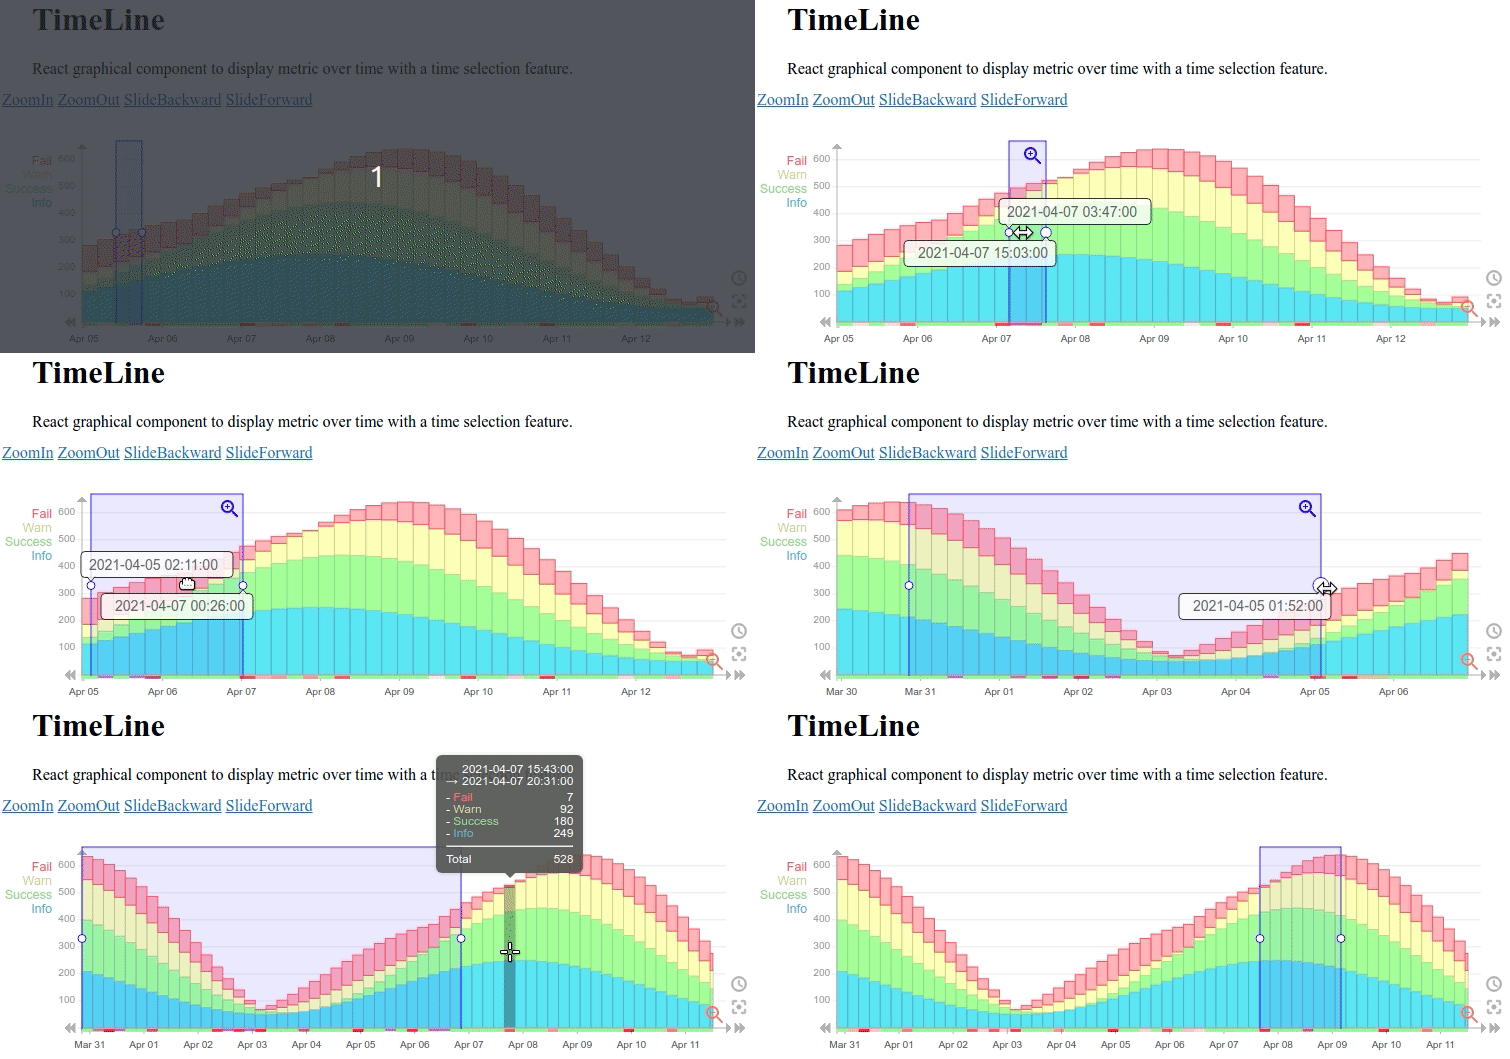
Some weeks ago, Timeline did not allow to zoom out from start.
- You could only zoom out to get back to zoomed in.
- On Spider, the default Timeline zoom was displaying all data.
That was an issue for performance, as getting the min and max of data across all historical indices was long (300ms to 5s). So I moved to a fixed zoom level based on the current time, and the ability to zoom out from start.
This was faster, and less stress for the server. Nice.
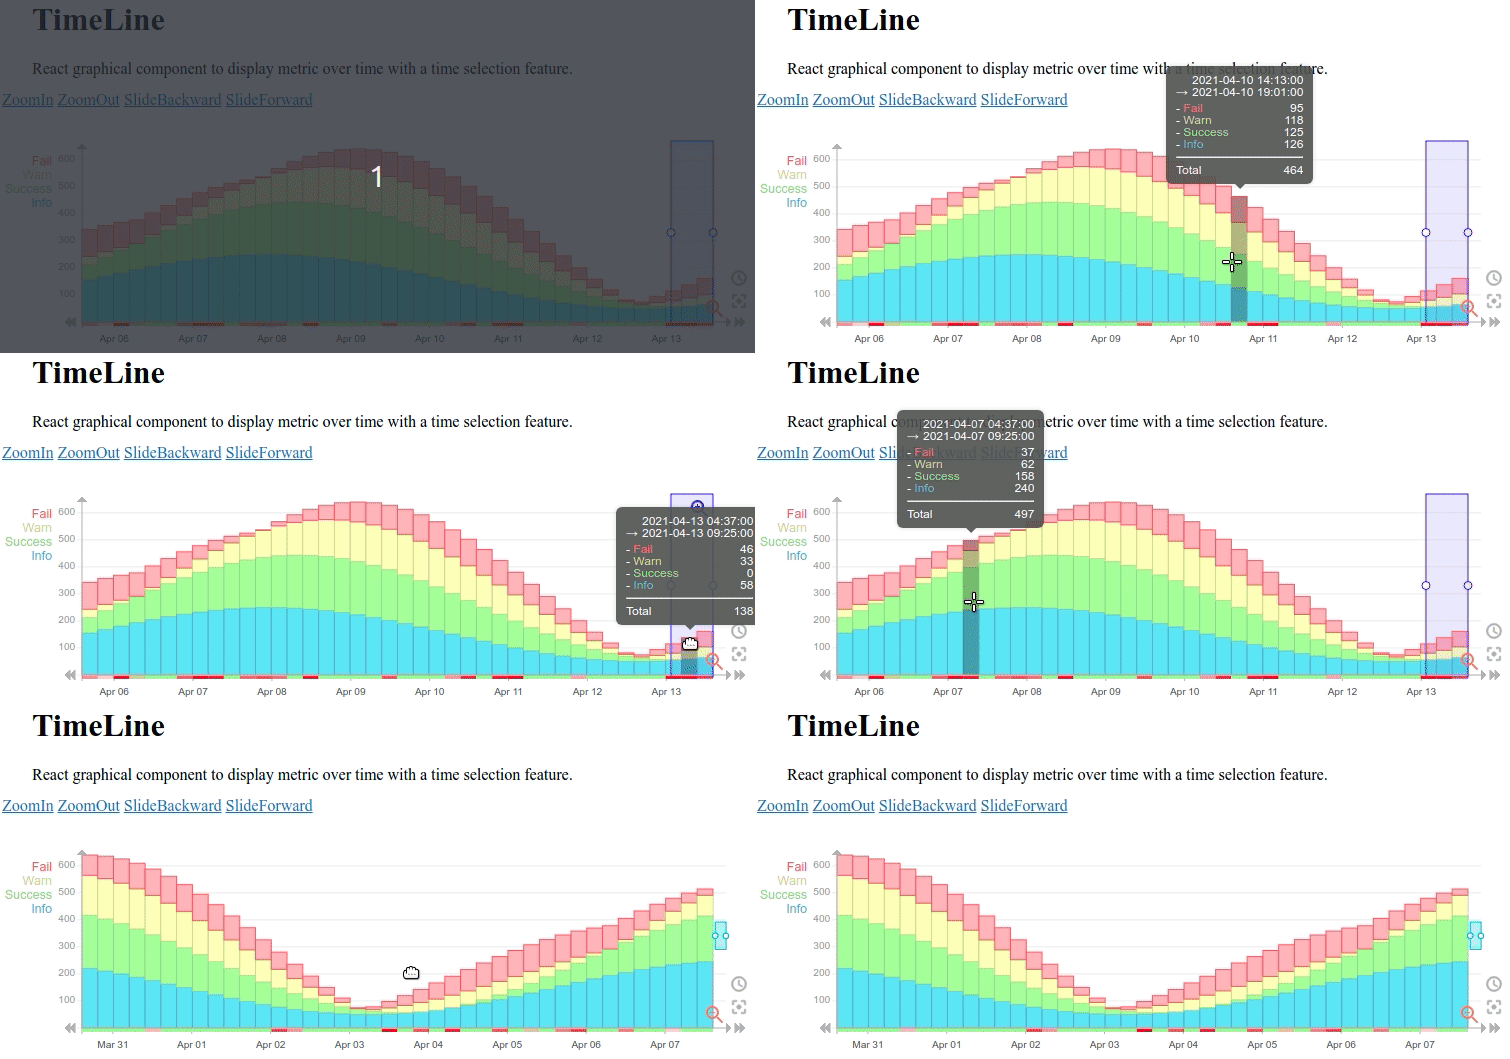
But then the Timeline UX was not good. When sliding the Timeline at first, the TimeLine was enlarging its domain instead sliding. This was linked to previous (no zoom) fashion, but was not anymore welcome.
So I did some feature removal and code cleaning. Removing some bugs on the way, and now, TimeLine sliding and initial zoom out is much better. With proper management of the domain limits (maxDomain).
This is v3.0 of Timeline: https://www.npmjs.com/package/@spider-analyzer/timeline/v/3.0.0
The zoom out factor can be set in the props!
Timeline tooltips
This was a request from Streetsmart team:
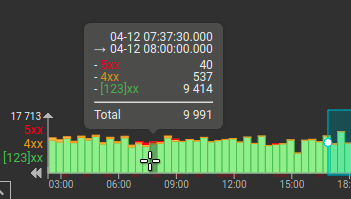
Implementing tooltips to display metrics information over the Timeline.
At first, it seems simple, but it was not.
- Indeed, HTML allows only one element to capture the 'onMouseOver' event. The first one under the mouse usually.
- And either the Dragoverlay layer or the Cursor layer were already capturing it.
- So, the histograms bar could not.
Then, I add to di it the old way:
- Compute the position on the mouse in the referential of the histogram
- Determine what bar was hovered
- Send the information to the histogram component
- And then display a darkening rectangle to show the hover effect.
- I also delayed the tooltip appearance, as a whole for the histogram, with a straight setTimeout, that is cleared onMouseOut
For better UX,
- Tooltips are hidden when sliding the Timeline or dragging/drawing the time selection.
All custom made :) But it rocks!
It is deployed on Spider Network and Monitoring UIs, and will be soon on Streetsmart!
The tooltip content as well as look and feel can be easily customized with component props and CSS.
This is v3.1: https://www.npmjs.com/package/@spider-analyzer/timeline/v/3.1.0
Upgraded Impersonate feature. Such a Joy to use for testing !
When implementing the Team feature, I needed to change often users and users right to check all access rights linked to Team.
That was getting cumbersome, and I decided to improve the impersonification feature instead!
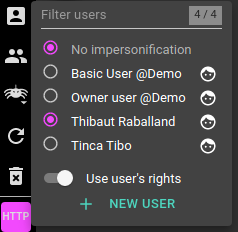
Now, a new API exists to impersonate a user, that generates a new token from your own, with inside:
- the impersonated user identification
- its whisperers access rights
- its own users rights (option)
One the UI, select if you want the selected users rights, and the UI and Services will behave as if this user was calling! However, all audit fields will still be valued with your own user. No cheating ;)
A shortcut option has also been added to get back your own rights fast when there are too many users.
It is damn helpful for testing, changing right and user within 2 mouse clicks!
More performance with a windowing Grid :)
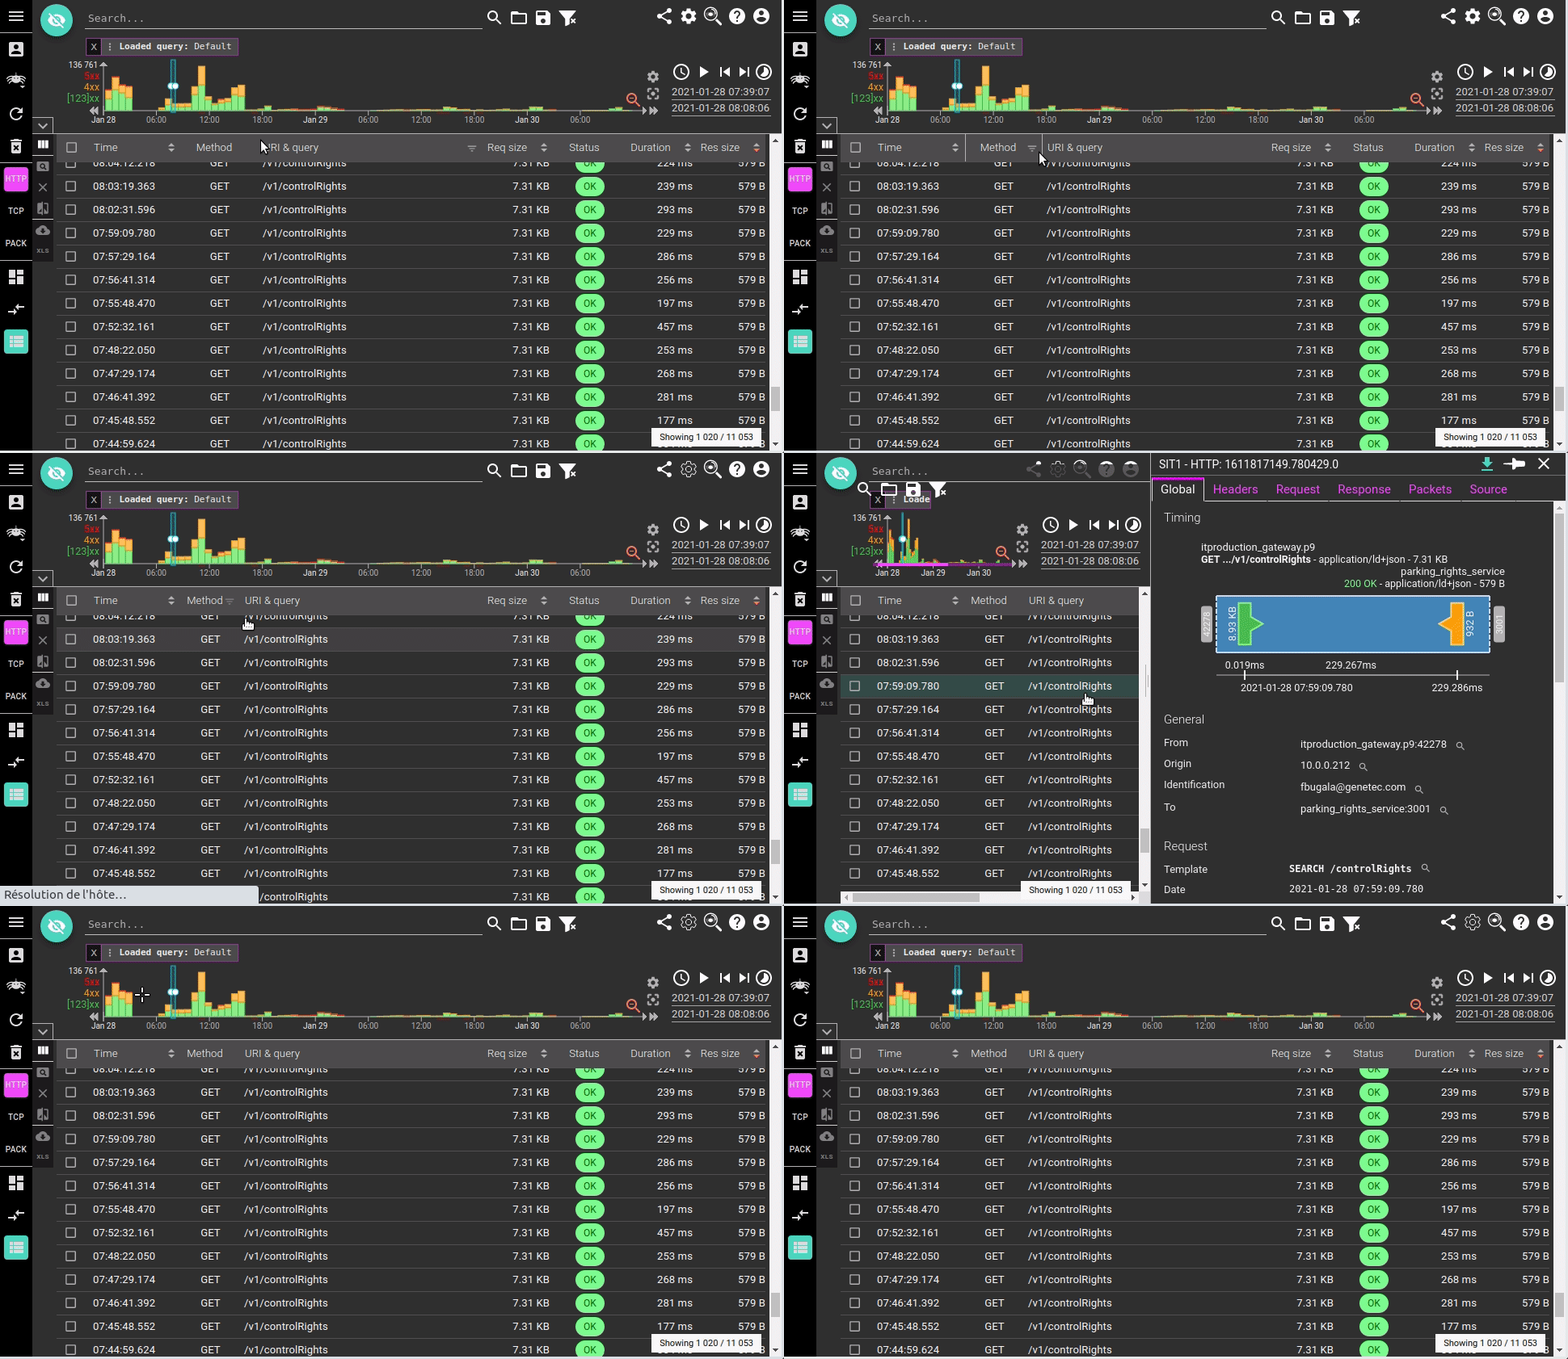
Rendering grid was getting slow once hundreds of rows were loaded. It affected resize of window, opening details and resizing columns, as these actions implied grid rendering.
After some thoughts on how to perform better, and some walkthrough various windowing libraries, I decided to implement windowing in the grid by myself, it would be less rework than integrating in a windowing library.
First trial: partial success after 2h30 work
A first trial was to still render all lines, but to render empty lines for lines outside the visible range. It proved I was right, windowing was working great to improve performance, but there was one drawback:
Too many rendering of empty lines when scrolling was introducing visible lags in scrolling.
I tweak it a bit, manage to get acceptable performance by triggering rendering only after a certain range of scrolling... But lag were still noticeable.
Second trial: solution ready with 30min more work
The night brought advice, as usual. I move the 'not rendering' one step above, to:
- Render a big empty line above the visible range with the cumulated height of all non rendered rows
- Render a big empty line below the visible range with the cumulated height of all non rendered rows
- Render only the visible range (plus a bit more) in between
And result is great :)
You may load thousands of records (if you have the stamina), the grid behavior and speed is constant.
- Resizing columns is fluid
- Opening details is almost immediate
- Resizing grid is immediate
- And scrolling is fluid. If you pay attention, you'll notice the lag. But, honestly it does not matter anymore :)
Example with a grid with 1000 rows loaded
Certificate decoder plugin
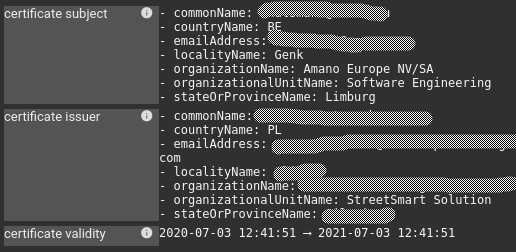
First 'official' plugin: a plugin decoding X509 certificate communicated in HTTP headers.
The plugin takes the name of the header in parameter:
And adds decoded field in the HTTP headers tab
It's now easier than ever to check certificates on integration!
The plugin code is freely available here: https://gitlab.com/TincaTibo/certificate-decoder-spider-plugin/
Park tag enrichment plugin
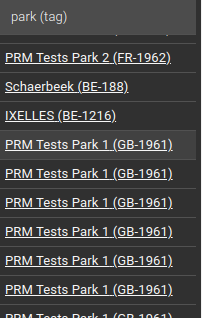
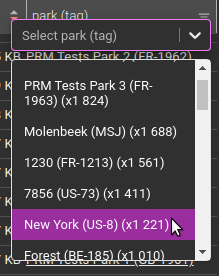
The plugin dereferences Park tags to display park name and parkCode.
For the plugin to work, Spider tags must be configured to extract park id from the HTTP requests & responses.
Parameters
The plugin takes 3 parameters:
- Environment: Streetsmart environment to calls to dereference the filters
- Login & password: Account used to connect to Streetsmart
- The account must exists on the selected environment.
- For now, it has been created in SIT0, SIT1 and SVT2
Result
- In grid
- In filter
- In smart filters
- In details
- In stats
- In excel exports
Code
The code is available in Flowbird bitbucket repo: https://bitbucket.org/parkeon-ondemand/sss-park-tag-enrichment-spiderplugin
The plugin:
- Request
/park/{id}if less than 5 parks to resolve - Build queryString queries if more than 5 parks, by grouping by 25 parks buckets
- Cache the results not to ask several times
- Blocks parallel requests not to ask simultaneously resolving of the same park
All this in a few lines, many nice patterns to reuse !! :D
Streetsmart token decoder plugin
The plugin extract Streetsmart rights from JWT token.
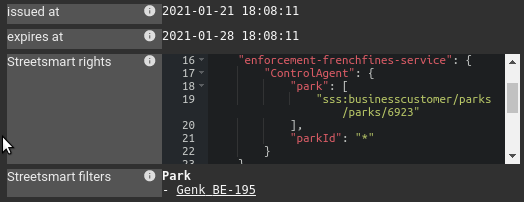
- The rights are displayed in a JSON editor for better readibility and folding
- The multitenant filters (parks or others) are extracted and dereferenced
Parameters
The plugin takes 3 parameters:
- Environment: Streetsmart environment to calls to dereference the filters
- Login & password: Account used to connect to Streetsmart
- The account must exists on the selected environment.
- For now, it has been created in SIT0, SIT1 and SVT2
Result
Code
The code is available in Flowbird bitbucket repo: https://bitbucket.org/parkeon-ondemand/sss-token-decoder-spiderplugin/
Copy to clipboard of arrays configuration components
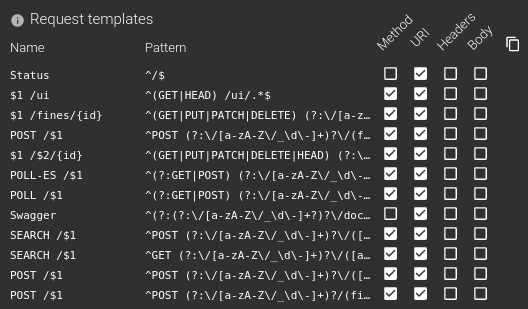
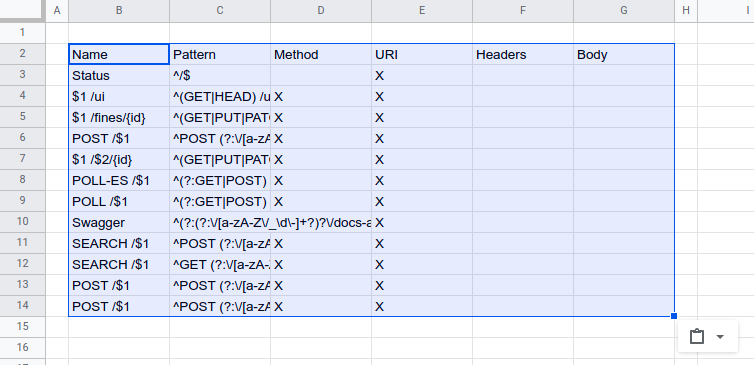
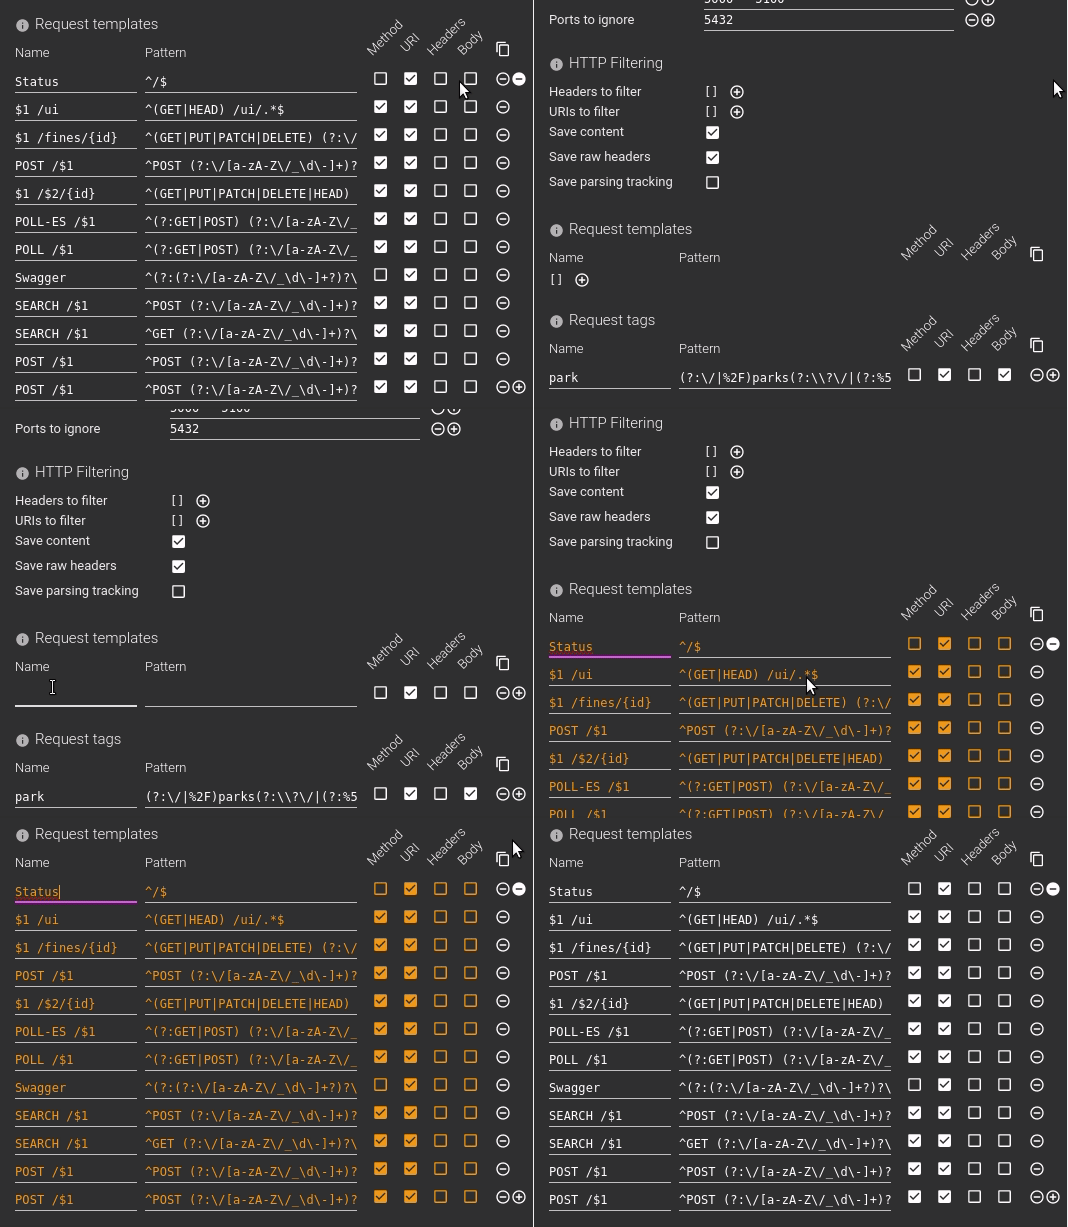
Configuration components such as the below one already allowed importing settings from spreadsheets by copy pasting in the first cell:
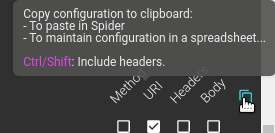
Now, they include an export feature to the clipboard. At the top right, you may copy the settings to the clipboard, including or not the headers:
The output can be pasted to Excel, Google sheet or ...
It can then be saved for later, or edited. Then pasted back:
Custom content types
As requested by Remi L,
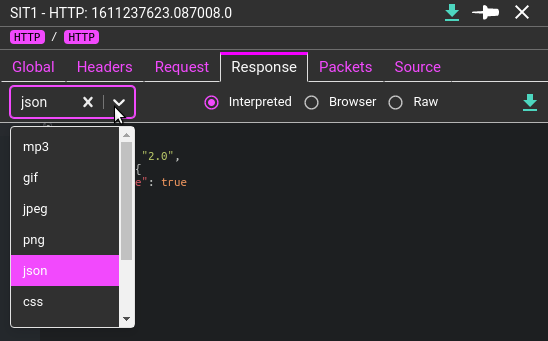
- When the request or response body does not include any content-type whereas there is a body, it is possible to chose a custom content-type to benefit from nice payload formatting and color syntaxing.
In the HTTP Request or Response time, you may chose the format of the payload:
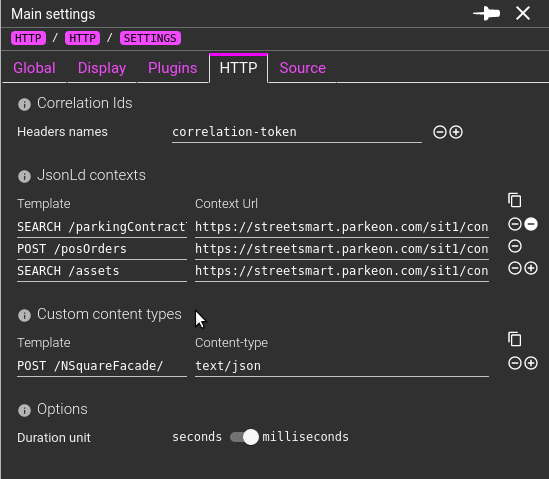
The payload is registered and associated to the request template so that it is remembered and applied for all same requests.
You may see and edit registered association in the HTTP specific settings:

