I was wondering for some time how to improve Spider usage to add specific features for projects or system being monitored while not coupling Spider code to those systems, such as Streetsmart.
I found a solution on ideas that I pushed on Streetsmart business apps architecture. A solution to extend Spider's UI with plugins.
Like nano frontends that add UI features into various parts of the application.
They are standalone Javascript files, implementing a specific signature depending on the plugin type. These plugins must come with their own manifest file providing metadata for the UI, and parameters definition.
The manifest is loaded in Spider UI, thus registering the plugin.
On the UI features accepting the plugins, they are loaded and called if activated (only then), and the results are injected in the UI.
Plugins are loaded in the Settings details:
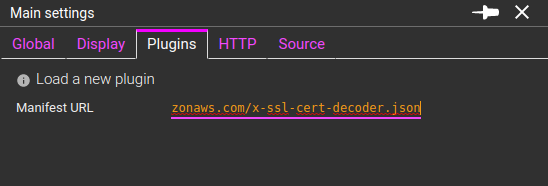
Once loaded, they are displayed in the same tab, with various options:
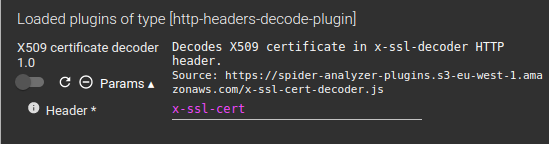
You may:
- Enable or disable them
- Reload them (useful when developing them ;) )
- Remove them
- And edit parameters
Each plugin may require one to many parameters to work or adjust its work. Parameters are defined in the plugin manifest.
For now, accepted parameters types are:
- Text - free input
- Password - free input
- Select - list of options : labels and values
Parameters may have a default values and validation constraints, as defined in the manifest. Parameters and loaded plugins are saved in users settings, except for password values. Those are not saved on server side, only locally.
{
  "@id": identifier for the plugin
  "@version": version,
  "@type": type of the plugin, as defined in Spider
  "manifest": location of the manifest, for reload
  "dist": location of the code
  "name": name for the UI
  "description": description for the UI
  "parameters": [ list of parameters
      {
      "name": name of the parameter in the UI
      "description": description of the parameter for the tooltip
      "valueName": name of the parameter expected by the plugin
      "valueType": type of input (TEXT, PASSWORD, SELECT)
      "valueRequired": boolean
      "defaultValue": any
      "maxValue": for numbers / later
      "minValue":for numbers / later
      "multipleValues": if many values may be selected
      "stepValue": if values are generated from min to max
      "valueMaxLength": max length if string
      "valueMinLength": min length if string
      "valuePattern": regex if string
      "optionValue": [ list of possible options for selects
        {
          "label": string to display
          "value": any
        }
      ],
      "onlyOptionValuesAllowed": if select accepts unknown values
    }
  ]
}
{
   inputs: {},
   parameters: {},
   callbacks: {setXXX, onShowInfo, onShowError, onShowWarning },
   libs: {React}
}
When called, the plugin is called with the above signature:
- inputs: specific inputs defined by the plugin type
- parameters: specific inputs defined by the plugin itself, in the manifest, the keys being the valueName
- callbacks:
- functions to emit info, warning or error messages (toasts)
- callback to return the result
- libs: libraries provided to the plugin
- React is provided and may be used to format the output
async function myOwnPlugin({
   inputs: {},
   parameters: {},
   callbacks: {setXXX, onShowInfo, onShowError, onShowWarning },
   libs: {React}
}){
   ...
}

function plugin(props){
    myOwnPlugin(props).catch(e => {
        props.callbacks.onShowError('myOwnPlugin: Could not work!');
        console.log(e);
    });
}

plugin\['@id'\] = 'my-own-plugin';
plugin\['@type'\] = 'http-headers-decode-plugin';
plugin\['@version'\] = '1.0'

if(window.spiderPlugins){
    if(!window.spiderPlugins.find(p => p\['@id'\] === plugin\['@id'\])){
        window.spiderPlugins = \[...window.spiderPlugins, plugin\]
    }
}
else{
    window.spiderPlugins = \[plugin\]
}
- Plugins must load themselves inside windows.spiderPlugins array.
- They may be promises and perform API calls
- They must attach their @id, @type and @version to the function. @id and @type must be the same as in the manifest.
- The result of the plugin should be returned
- As the promise result
- And by the callback
- You're advise to copy the code above :)
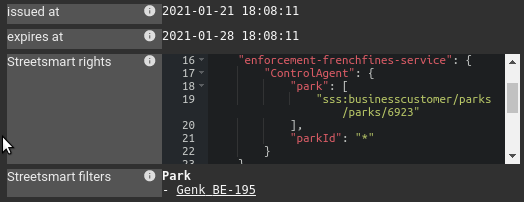
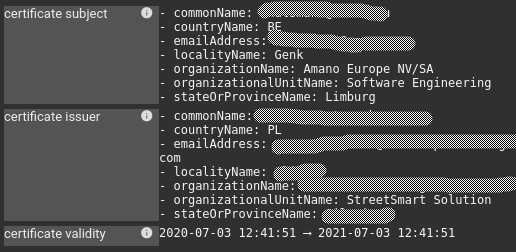
These plugins allow decoding HTTP headers, in request or in response, to reveal their inner data.
This was the original plugin need/idea: decoding Streetsmart rights that are compressed inside the JWT token.
{
   inputs: {part, header, value},
   parameters: {env, login, password},
   callbacks: {setDecodedHeaders, onShowInfo, onShowError, onShowWarning },
   libs: {React}
}
The plugin is called for each header.
- part: 'req' for request headers or 'res' for response header
- header: name of the header, in lower case
- value: the header value
setDecodedHeaders callback expects an array of objects with this structure:
{
    key: String, label to display in the UI
    value: Any, value to display
    format: String, format of the value
    decoded: Boolean, whether or not the header is decoded (gray background in the UI)
}
- format may be one of:
- application/json, application/xml --> displayed in ACE editor
- text/plain or react --> displayed as such
- Decoding Streetsmart rights
This plugin extends the tag extraction feature by allowing to dereference / enrich a tag from data of your own system and inject these in the UI.
For instance, a tag could extract the city id of the client of the requests, and get the city name from the system under monitoring. Then filtering becomes easier, and Excel extract, statistics and grid becomes more meaningful.
{
   inputs: {name, values, mode},
   parameters: {basePath, login, password},
   callbacks: {setDecodedTags, onShowInfo, onShowError, onShowWarning },
   libs: {React}
}
The plugin is called:
- For each row, and each displayed Tag in the Grid or Excel export
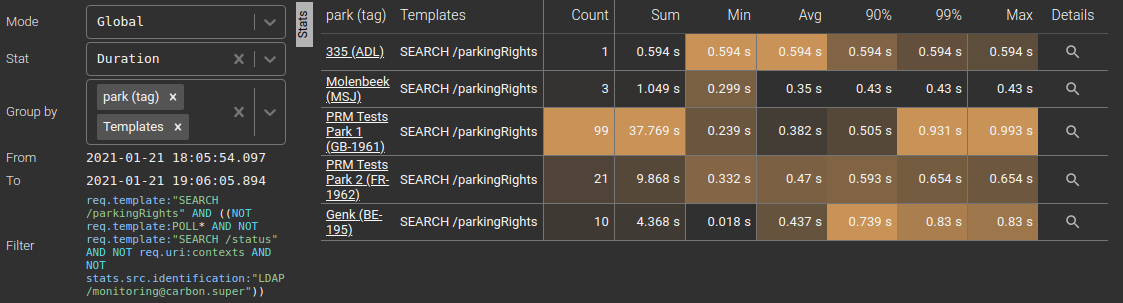
- For each group for stats grouped by Tag and Excel export
- For each Tag in the HTTP details panel
- For each Tag and all Tag values for the Filters component in the grid header
Depending on the call, the output is requested in REACT components mode (grids and details) or in TEXT mode (Excel, filters)
- name:
- values: array of tag values
- mode: 'REACT' or 'TEXT' for the output type.
Expected output expects an array of decoded values, in the same order, without holes as the values array input.
Output must be sent both:
- Using setDecodedTags callback
- With a return value (of the promise)
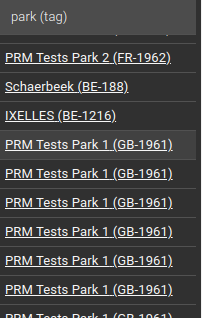
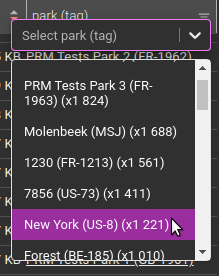
Resolving parks names:


An http-headers-decode-plugin plugin example is available in https://gitlab.com/TincaTibo/certificate-decoder-spider-plugin/.
It may be reused and extended at will.


