I rework Tags features to merge request and response tags into one result. Indeed, after using it, it offers better UX.
For instance, in Spider, you may defined Park id extractor:
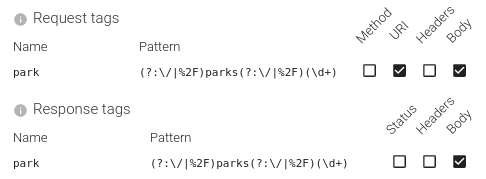
These regular experssions will instruct Spider to extract the internal id of the parks referenced in the communications, and to save them in park Tag.
Spider will then, when parsing, unzip the communications, run the regular expressions and extract the values.
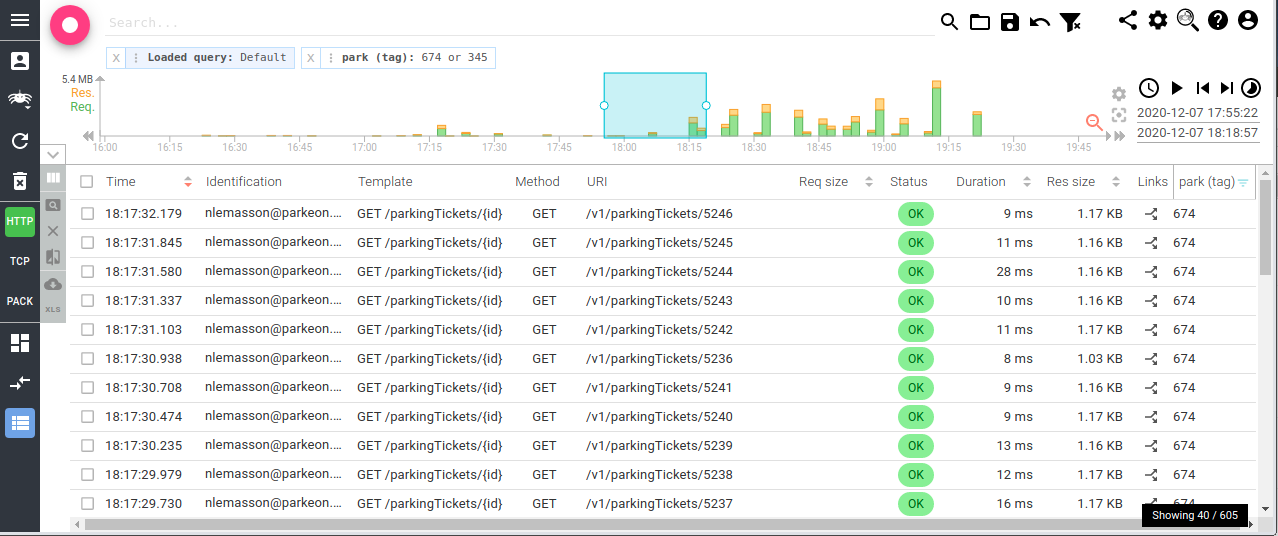
The park column can then be added to the grid and filtered. Thus adding a nice filtering criteria when working!
Last, but not least, you may even do stats! For instance, let's compare the latency of parkingRights call depending on the park configuration:
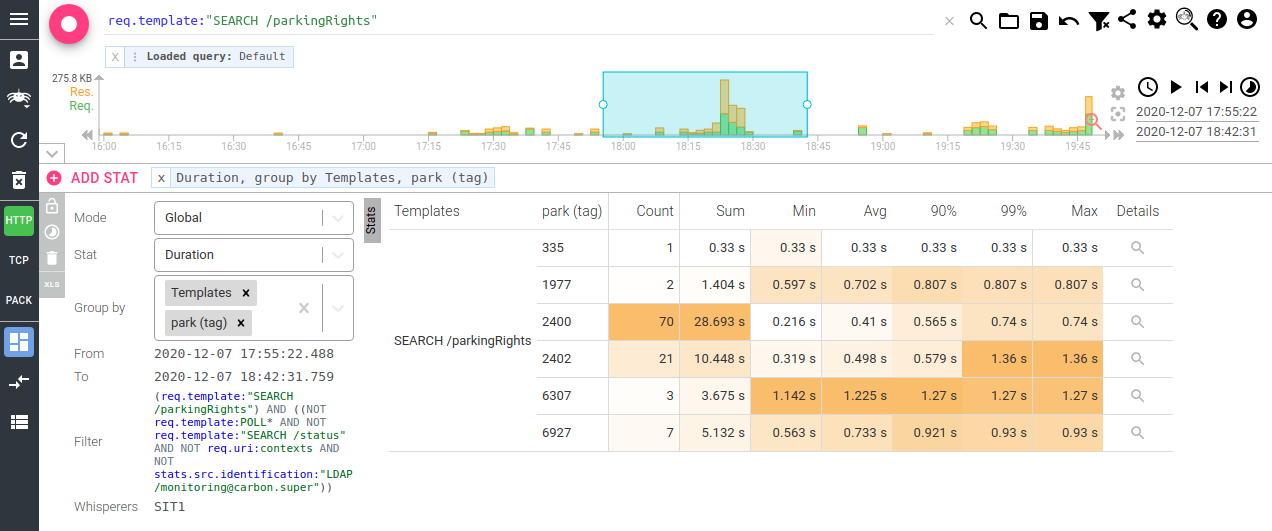
That's amazing !! :)


