156 posts tagged with "features"

View All Tags

Log Codes are finally there :)

· 3 min read

Log codes​

I enforce them in all systems I helped created in my professional work... but completely forgot them when starting Spider. And technical debt...

What? Error codes! Or more specifically Log codes.

And this was painful:

  • Log codes help regrouping quickly logs of the same meaning, reason
  • This is much useful:
    • To discard them
    • To analyse a couple of them and check if there are not other errors
    • To regroup common issues from several services as one (infra issue)

Spider implementation​

So, during code refactoring,

  • I added Log code to all Spider logs in Info, Warn, Error and Fatal levels.
  • Pattern: [Service code]-[Feature]-001+
  • Service code is replaced by XXX when the log is in common code

I then added a new grid in monitoring that shows a quick and small analyis report on those logs.

And in one glimpse, I'm able to see what happened and if anything serious need to be looked at in the day before ;) Handy, isn't it? I like it much!

Demo​

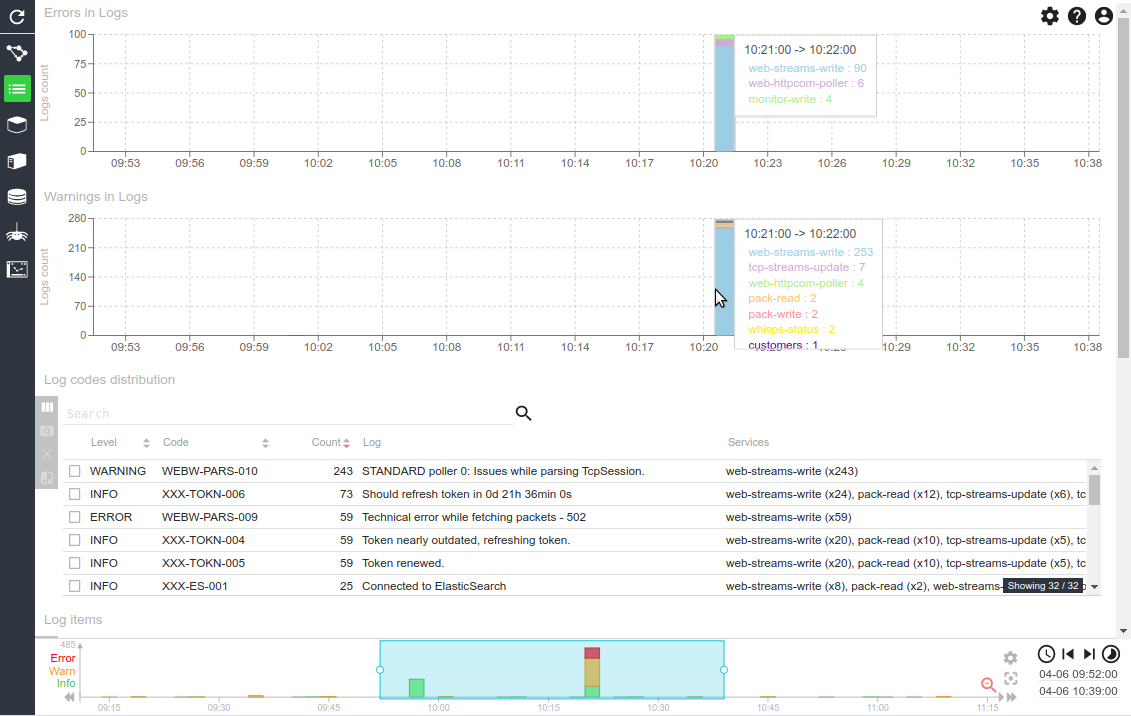
For instance, today, at 11h21:

  • Many errors were generated during parsing process
  • At the same time 25 services instances reconnected to Elasticsearch and Redis at once...
  • This looks like a server restart

Indeed, looking at Servers stats,

  • Spider3 server restarted, and its services were reallocated to other nodes:
    • Huge CPU decrease and free RAM increase on Spider 3
    • CPU increase and memory decrease on other nodes

This is confirmed on the grids.

Before

After

Why this restart? Who knows? Some AWS issue maybe... Anyway, who cares ;-) ! The system handled it gracefully.

  • I checked on the server itself... but the uptime was days ago. So the server did not restart...
  • I then checked on Docker daemon logs (journalctl -u docker.service)

  • msg="error receiving response" error="rpc error: code = DeadlineExceeded desc = context deadline exceeded"
  • msg="heartbeat to manager failed" error="rpc error: code = DeadlineExceeded desc = context deadline exceeded" method="(*session).heartbeat" module=node/ag
  • msg="agent: session failed" backoff=100ms error="rpc error: code = DeadlineExceeded desc = context deadline exceeded" module=node/agent node.id=75fnw7bp17gcyt
  • msg="manager selected by agent for new session: " module=node/agent node.id=75fnw7bp17gcytn91d0apaq5t vel=info msg="waiting 50.073299ms before registering session"

Looks like this node had an issue communicating with the Swarm manager for some time, and the services were reallocated... Sounds like a network partition on AWS.

It is told that you have to make sure your architecture is resilient on the Cloud... Done ;-)

Although, I still need to rebalance the services manually... for now :(
Timeline now shows communications over all their periods

· 2 min read

Long going issue​

There had been an issue from the beginning with Timeline component and its representation:

  • Items that have a duration, like Statuses, Http coms, TCP sessions and so, were only represented on the timeline at the beginning of the item.
  • Doing more with a single query was highly costly, if even possible.

This meant that you could have a hole in the Timeline when in fact, there were ongoing communications in this time.

Things have changed: Elasticsearch improved!​

- With ES 5.x, Elastic introduced 'range' data type that allows to define a range of numeric values or a range of time, a duration in other terms.

- With ES 7.4, Elastic have upgraded their histogram aggregation to manage ranges :) Yeah!

For range values, a document can fall into multiple buckets. The first bucket is computed from the lower bound of the range in the same way as a bucket for a single value is computed. The final bucket is computed in the same way from the upper bound of the range, and the range is counted in all buckets in between and including those two.

Reference : search-aggregations-bucket-histogram-aggregation

What it means is that, when performing an aggregation over a range field, ES is collecting in each histogram bar all items whose range intersect with the bar.

So doing, a long opened status will appear in all minutes / hours / days it is opened. Which is much better for the graphical representation :)

Implementation in Spider​

  • Nothing changed on Timeline component, nor on the UI queries, but I introduced date ranges fields in the resource, and now, all search queries use them.
  • And... this is even a bit faster ;-)

Demo​

We can see a long POST /create_session request, lasting 2.7s.

Automated setup ! :-)

· 2 min read

Spider configuration crazyness​

I figured out that if I wanted easy adoption of Spider, I had to improve the setup.

Indeed, the way to setup Spider was cumbersome! If the infra (Elasticsearch cluster, Swarm applicative cluster) can be automated with Terraform and Ansible, the cluster configuration involves many assets:

  • Microservices configuration: 34 files
  • File beat & metric beats configuration: 2 files
  • JWT keys
  • SMTP configuration
  • Traefik configuration
  • Elasticsearch indices provisioning (and maintenance)
  • Swarm cluster configuration: 10 files

All those files having parameters with consistent values, links and a lot of potential failure in case of wrong configuration. Moreover update of configuration on evolutions was really a pain involving GIT history, diff and so on.

So I decided to automate Spider setup and update.

Result​

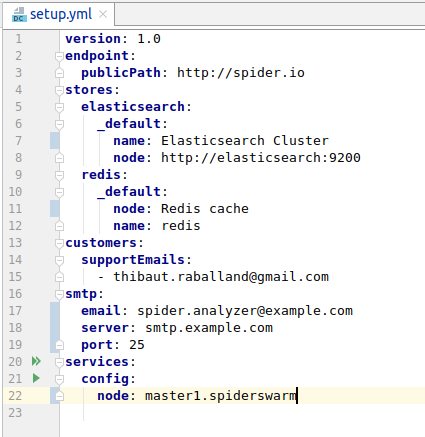
The result is ... WoW :) (not Blizzard one, my own :-p) Here is the 'minimal' configuration file to have a running Spider installation, from scratch:

22 lines :-) Neat !

How it works​

Original setup​

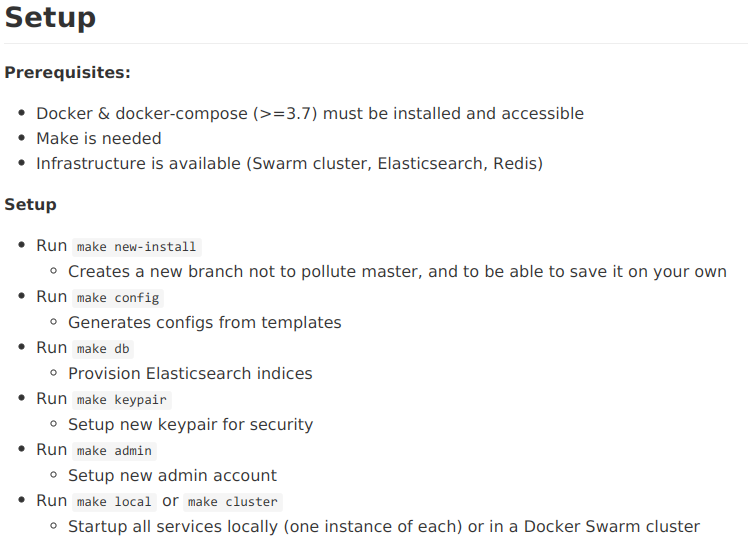
Setup instructions are summarized in 4 steps/commands and all configuration is in one file now. From this file, a bunch of scripts:

  • Validate the configuration
  • Take configuration templates and create the environment own configuration from them
  • Provision or update the indices
  • Create the original admin account
  • And start the cluster :)

Here are the setup instructions:

Configuration templates are available in a GIT repo that will receives updates for all new features.

Upgrades​

  • 'make update' will rebase the local repo with the trunk
  • After which a 'make config db cluster' will be enough to update current installation.
  • And of course, in case of new required setup values in setup.yml, the user will be told, and the update stopped.

The indices update is automatic and based on metadata added to the indices. It handles parent templates, ILM policies, rolling over indices, rolling up indices and static indices.

  • Rolling over, reindexing and cache purging is all handled programmatically., and automatic. This is so goood =)


What do you think? Do you like it? I did a demo of ideas and execution to Streetsmart DevOps team today... and I think we'll target the same kind of improvement for Streetsmart! Yeah :-)

New saving options - TcpSessions and Http parsing resources - leading to a huge optimisation !

· 2 min read

New saving options​

Due to upgrade to Redis 5.0.7, a bug that I'd been tracking for months has been solved (on Redis ;) ), and now parsing quality is 100% :-) apart from clients issues.

Then I moved to next phase: it is possible not to save parsing resources any more, thus leading to a huge optimisation in Elasticsearch usage...

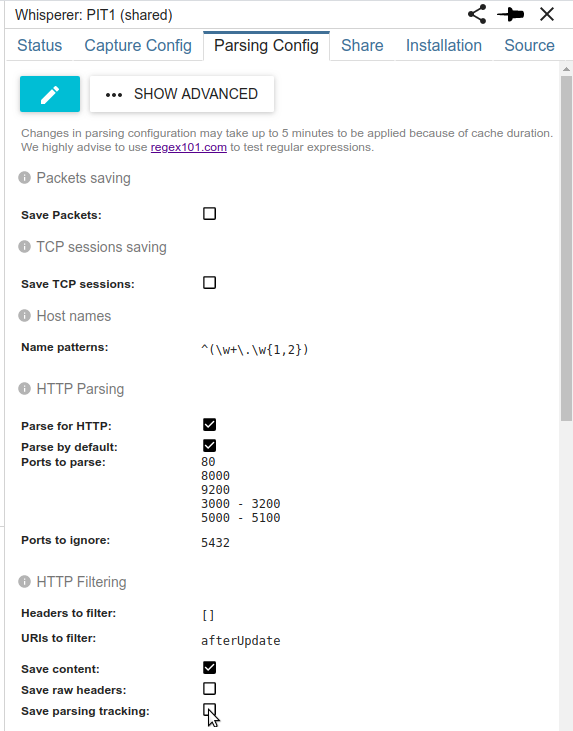
For this, I recently added two new options in Whisperer configuration:

  • Save Tcpsessions
  • Save Http parsing resources

No need to save those?​

As for most cases, at least on Streetsmart, we do not work with Tcp sessions and Http parsing resources, there is no use to save them in Elasticsearch.

  • These resources are indeed only used to track parsing quality and to troubleshoot specific errors.
  • These resources are also saved on Elasticsearch for recovery on errors... but as there are no more errors... it is completely possible to avoid their storage.

I had to change the serialization logic in different places, but after a couple of days, it is now stable and working perfectly :)

The whole process of packets parsing is then done in memory, in real time and distributed across many web services in the cluster, using only Redis as a temporary store, moving around 300 000 packets by minute 24h/24, amounting to almost 100MB par minute!

That's beautiful =)

What's the result?​

  • Less storage cost
  • Less CPU cost for Elasticsearch indexation
  • More availability for Elasticsearch on the UI searches :-) You must have noticed less timeouts these days?

On UI, when these resources are not available, their hypermedia links are not shown. And a new warning is displayed when moving to TCP / Packet view:

Currently, Tcp sessions and Packets are only saved on SIT1 and PRM Integration platforms. For... non regression ;)

One drawback though​

Those resources where rolled up in Elasticsearch to provide information for the parsing quality line at the bottom of the timeline. :-/

As I got this evolution idea AFTER the quality line implementation, I have nothing to replace it yet. So I designed a new way to save parsing quality information during the parsing, in a pre-aggregated format. Development will start soon!

It is important for transparency as well as non regression checks.

Upload Whisperers now have their own storage rules, and purge is back :)

· One min read

Thanks to Leo, we just found out that recent evolution with Index Lifecycle Management had removed the possibility to purge the data manually uploaded to Spider.

I then changed a bit the serialization and storage architecture so that Upload Whisperers have dedicated indices and lifecycles.

Thanks to index templates inheritance and a clever move on the pollers configuration, the changes where pretty limited :)

So now:

  • Uploaded data are kept for several weeks.
  • Uploaded data can be purged whenever you don't need them anymore

Parsing quality

· 3 min read

I recently added a new feature to Spider timeline:

It now shows the parsing quality of Spider for the selected Whisperer(s).

What do I mean by this?

Explanation​

Spider captures packets, then sends them to the server that rebuilds the network communications. Due to the massive amount of packets received (around 4 000/s on Streetsmart platform, 300 million a day), they are processed in real time with many buffers to absorb the spikes.

However, trouble may get in the way in many places when a spike is too big:

  • On client side:
    • The kernel buffer may get full before pcap process all packets
    • The pcap buffer (network capture) may get full as well
    • Spider server may not be able to absorb the load, and the Whisperer buffer may overflow (by backoff)
    • The same may happen for Tcpsessions tracked on client side... but I never saw this happen.
  • On server side:
    • Under too much load, or infrastructure issue, the parsing may not find all packets (Redis buffer full) and fail to rebuild the communication
    • And there is currently a 'last' bug that happens under high load as well that sometimes packets cannot be found.. although they SHOULD be there (I'm trying to track this one down, but this is not easy)

All in all, there are many places where it may go wrong and that could explain that you don't find the communications you expected!

This information of the goood health or not of the system is available in Spider monitoring, but not so easy to process.

Quality line in timeline​

Thus I designed an enhancement of the timeline so that you know when the missing data MAY be a Spider issue.. or if it is indeed due to the system under monitoring ;)

Below X axis, you may see underlined parts in red. They tell you that there have been parsing issues in the period. The redder the worse. (Timeline is showing PIT1 on november 21st)

You will then find detailed information when hovering on them:

Lots of red !!​

Don't be afraid, the quality is good:

  • The light red is the first threshold. Here, we lost 8 packets out of 2 millions! Looks like there has been a surge of load at this time, and Spider could not absorb.
  • Over the full day, on PIT1, we could not parse 11 communications out of 2,2 Millions. That's 99.9995% quality!

If failures happens too often, the buffers need to be enlarged, or the server scaled up...


So now you know, and when it gets really red, call me for support ;-)


Hide the line​

You may hide this quality line - and avoid making the queries - in the timeline menu. This settings is saved in your user settings.

Last info​

This is PRM integration platform. It is much redder. Indeed, there are many packets lost by pcap. And this is due to the old Ubuntu version!

Indeed, pcap filters are applied after capture on this Ubuntu version, and not before. Thus, the pcap driver captures all packets of all communication in its buffer before filtering and sending them to the Whisperer.

I enlarged pcap buffer from 20 to 60MB on this server, but it is not enough still. If Yvan, you are missing too many communications, this can be the cause, and we can enlarge the buffer again. It is easy to do, it is done on the UI ;-)

LDAP authentication!

· One min read

Spider now supports delegation of authentication to an external LDAP server :)

Getting ready for the enterprise!

Improved tooltips for Network Map

· 2 min read

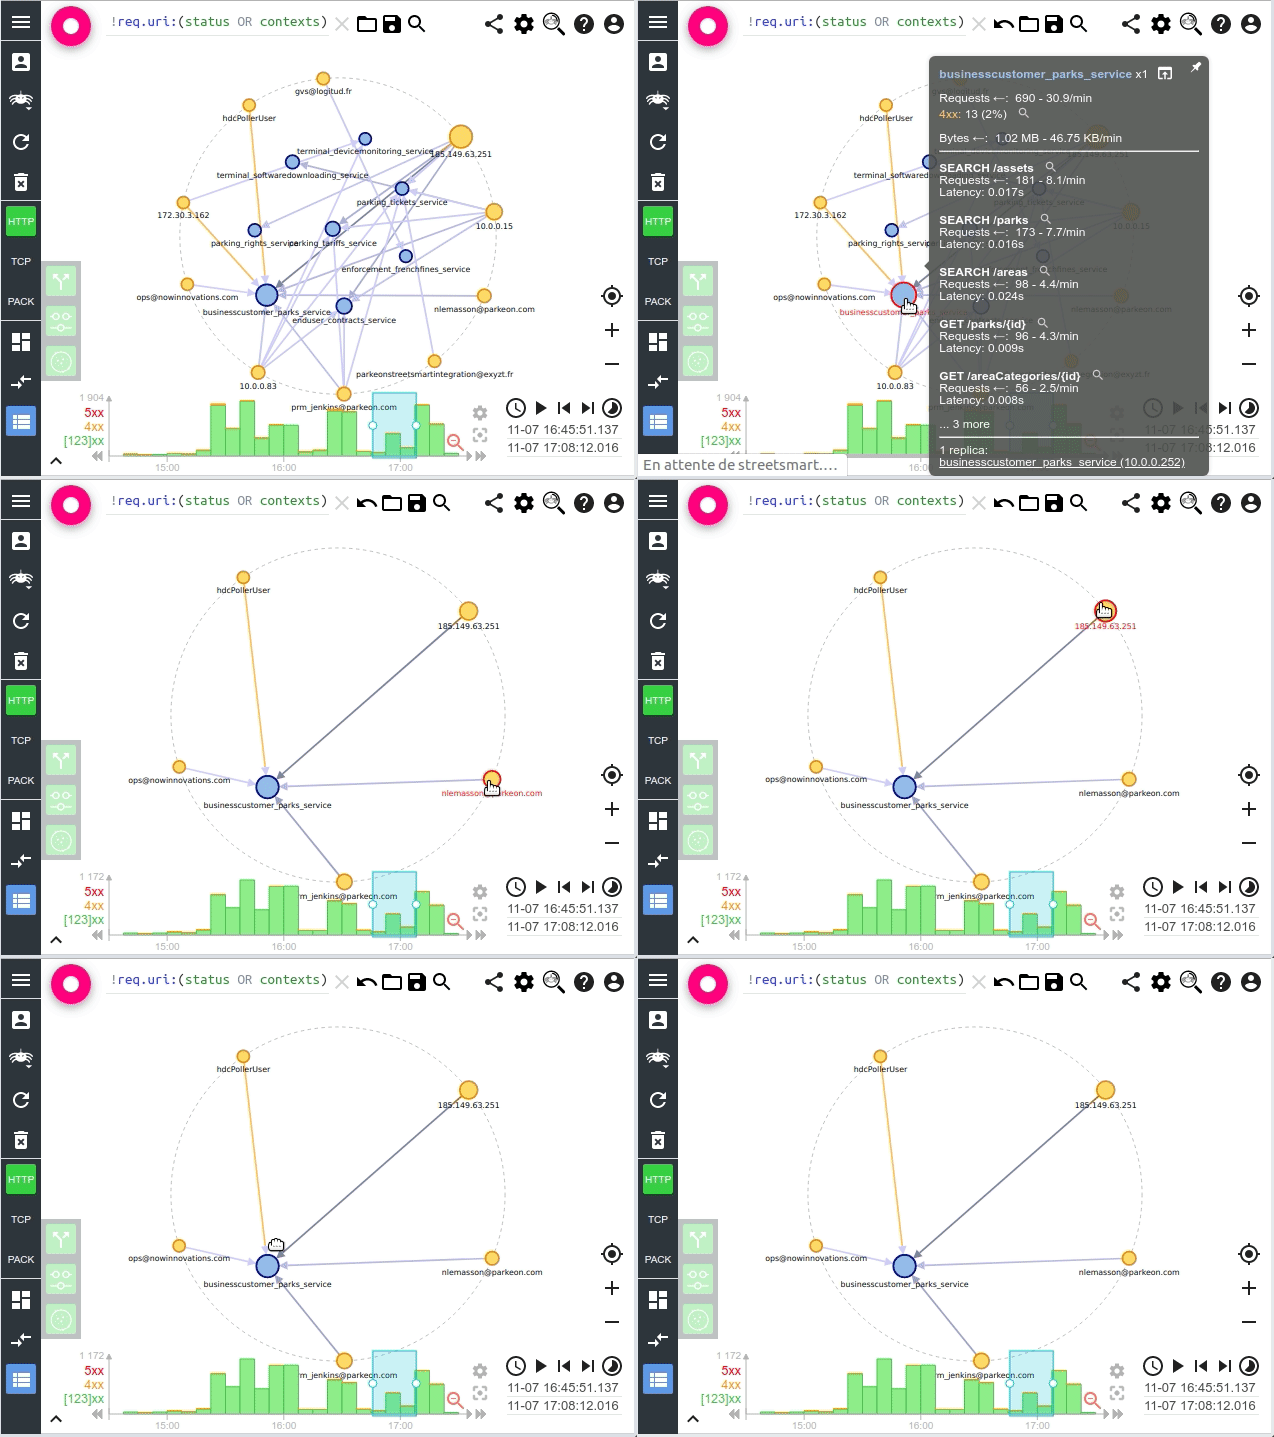
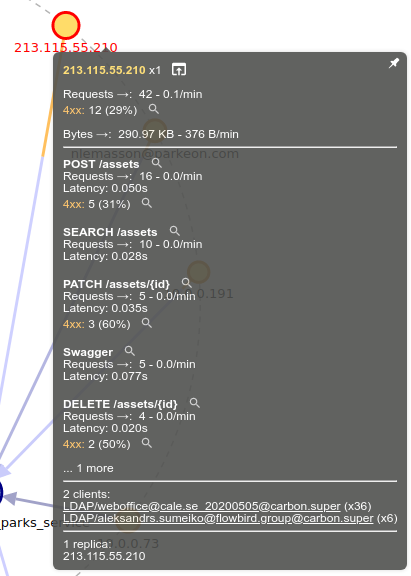
What's coming here is the original reason for the rework of Templates. Templates are enriching the tooltips displayed on Nodes and Links, with new filters, more valued added data and other add'ins coming from the work I achieved on my monitoring UI.

See the changes by yourselves, they are live :)

Server nodes​

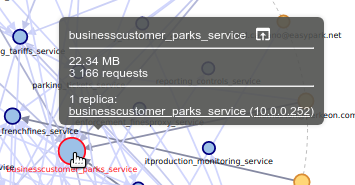
Before

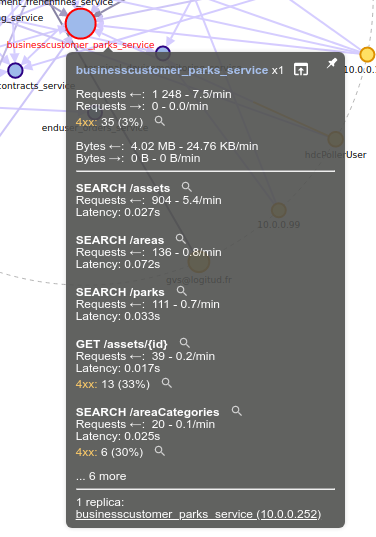
After

The tooltip include a summary of the Node activity over the selected period:

  • Count of replicas
  • Count and rate of requests in and out
  • Errors listing of there are
    • 4xx
    • 5xx
    • No response
  • Load and speed of data exchanges
  • And, for the 5 more used templates:
    • Count and rate of requests
    • Avergage latency
    • And errors

For errors and template a quick filter icon allows you to filter selection on these communications, or to remove them from selection (if clicked with Ctrl).

It is pretty handy :-)

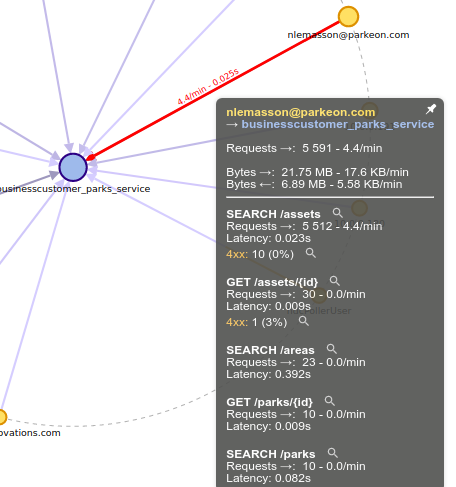
Client nodes​

Before

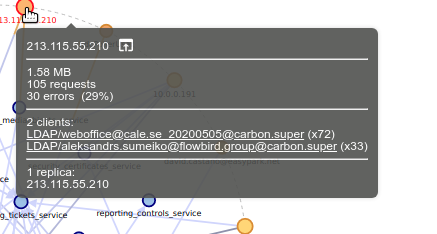
After

As for servers, we now see rate of requests, templates of requests called and latency, with the previous information still present.

This makes it much quicker to see what client calls what.

Before

After

The links data has already been much improved, on the same model.

New over the arrow display​

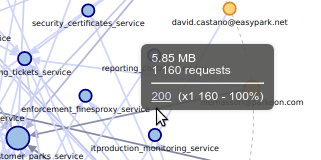
As for the monitoring dashboard, I added over the arrow display on the chart. When overing a link, you quickly see the global request rate and average latency. As seen on the above screenshot.

Pinnable tooltips​

All the above tooltips can be pinned with their top right icon. This allows to quickly compare different time window, by moving the time selection on the timeline and seeing the metrics being updated!


Those tooltips may have other quick improvements in the weeks to come, with feedback from usage and from you! :) Tell me if you find this useful! The whole goal is to speed analysis up, more and more.

Cheers

Custom contexts for JSON-LD payloads

· One min read

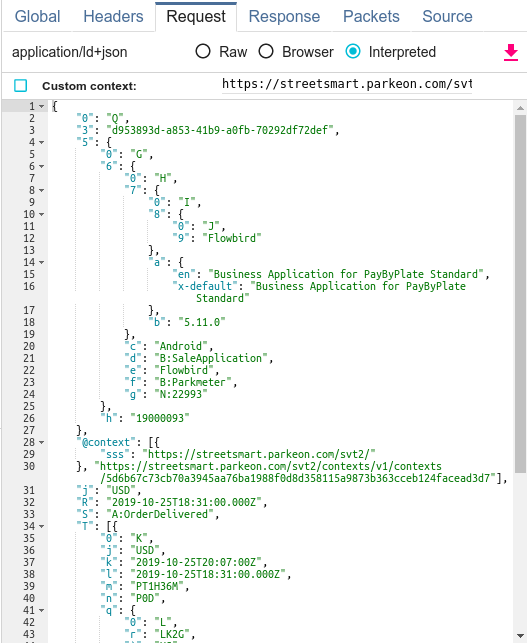
JSON-LD recompaction​

JSON-LD payloads may be very custom. Between the client context and the server context, there can be many difference that fundamentaly change the JSON representation.

In Streetsmart,

  • This feature is used to uglify and condense payloads from devices.
  • This feature is used by clients that may use different contexts than the server's.

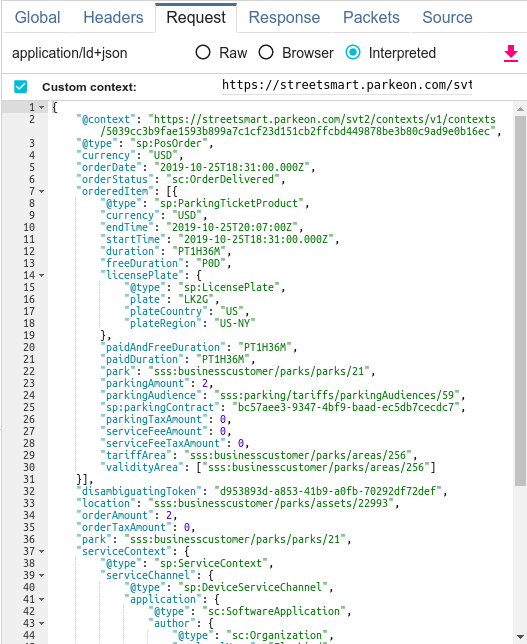
Some payloads become very difficult to read:

You may now define custom contexts to recompact the JSON-LD payload into a more readable JSON:

This payload is the same in JSON-LD sense. But much better in human eyes ;)

Contexts and templates​

In order help you even more, the custom contexts that you defined are saved in your user settings, associated to the template of the request / API endpoint (if a template has been defined).

Thus, you may define different contexts... for different endpoints, and you don't have to keep then anywhere, Spider does it for you :)

Review​

Please tell me how it feels after usage. It is a quick dev. So, suggest me any improvement you need!

Cheers!