Dashboard
On high volume systems, the map reveals too slow, too crowded to be useful.
I decided to add a predefined dashboard to compensate its usage.
But this dashboard grew beyond my initial thoughts 😅, because it already revealed pretty useful!
Even this first official release includes lots of goodies 🤩!
Presentation
The dashboard is available in all views:
- HTTP
- TCP
- Packets
It is customisable.
Users may choose:
- The widgets to display
- Their disposition
It is dynamic.
Users may filter and drill down from the dashboard as much as anywhere in Spider.
It is responsive and adapts to the viewport of the user.
When too many widgets are selected, you may scroll vertically, even if this should be avoided. This is indeed bad practice for dashboards design 👎.
Its configuration is saved with the user settings.
Saving and associating to teams settings may come in a later stage. As for saved queries.
Many widgets have a link to the Stats view to get more information and export the complete data.
Last but not least, it may show business widgets!
A wide list of widgets are available for tags, to get latency, load or errors linked to your own tags!
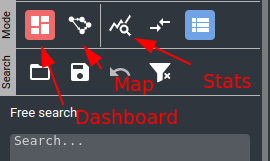
New navigation
You may now switch between map and dashboard from the menu. It changes the main screen content.
The statistics icon has changed also.
Dashboard
The dashboard is composed of widgets that adjust themselves in position in a responsive manner.

Widgets
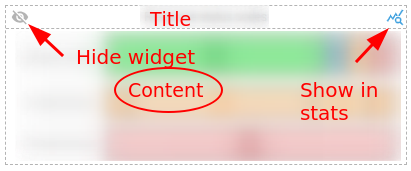
Widgets have all the same structure:
- A title at the top
- A content in the middle
- A top left button to hide them
- A top right button to open the stats bottom panel with more data on the content
Most widgets also have internal filters inside the content that allows fast drill down and focus.
With them, you may filter on data (click) or ignore data (ctrl + click), as for any other filters in Spider.
Dashboard configuration
Dashboard configuration is accessible from the bottom left button of the dashboard.
It opens a right panel where you may:
- Select widgets to display
- Change disposition of widgets
- Remove widgets from your selection
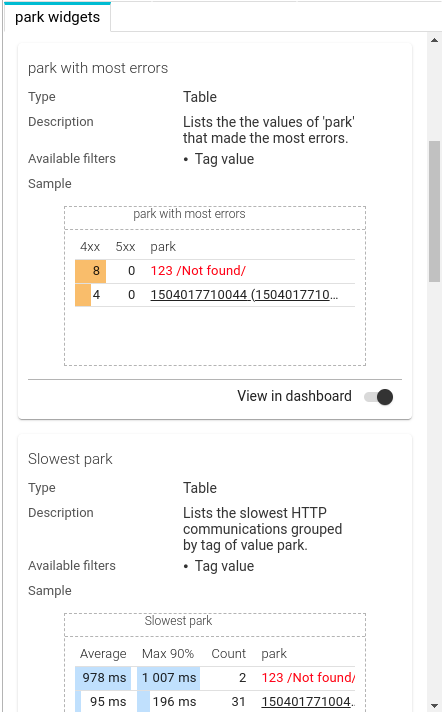
The first tab shows all selected widgets to customise their disposition.
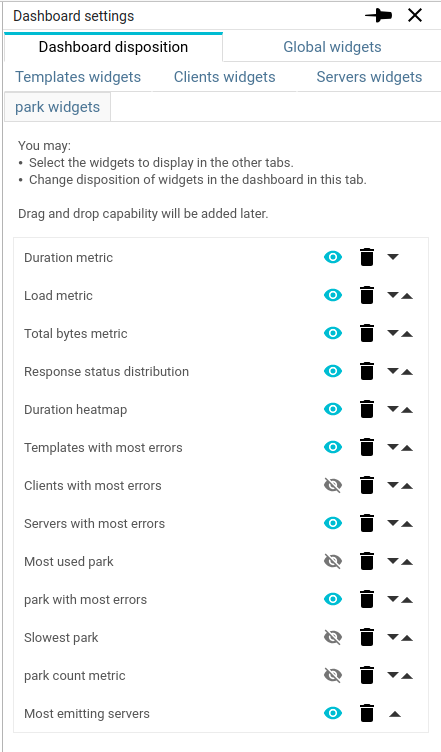
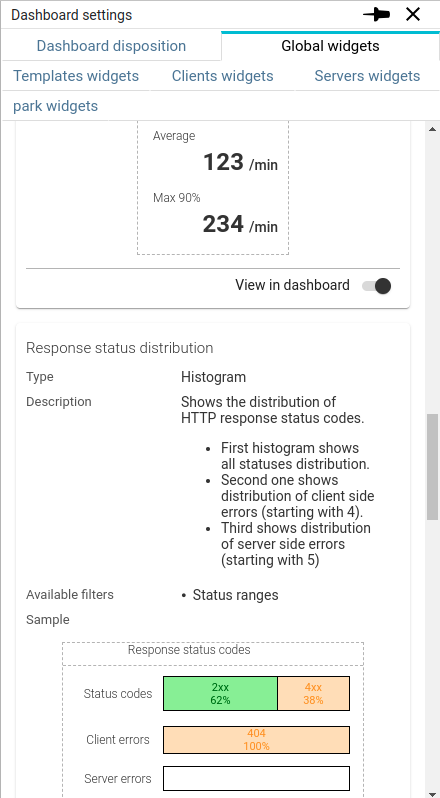
Each subsequent tab shows a widget list with widget descriptions, sample and selection toggle.
Widget categories
Widgets are grouped in various categories, one by tab, for easier selection:
Standard statistics
| Category | Description | Widgets |
|---|---|---|
| Global | Global statistics over the period |
|
| Templates | APIs focused statistics |
|
| Clients | Client focused statistics |
|
| Servers | Server focused statistics |
|
Business statistics
On top of standard statistics, Spider mau also provide business focused statistics depending on the tags defined on the selected whisperer.
For each tag:
- A new category is created
- A set of widgets is associated to it
These widgets statistics may or may not have meaning depending on your business tags.
But it's up to you to compose the most meaningful dashboard 😉
When selecting a whisperer not having the relevant tag for your widgets, they won't be shown... not to show empty widgets!
List of widgets available for each tag:
- Most used
- Most errors
- Slowest
- Count metric
- Cardinality metric
- Count heatmap
- Cardinality heatmap
Widgets rendering
To have a clean display, Spider applies the 'regular' display transformation on widgets as well:
| Object to display | Transformation |
|---|---|
| Server |
|
| Client |
|
| Tag |
|
Behind the scenes
In the background, Spider is generating ONE unique query for all widgets of the dashboard, thus optimising the speed of data fetching.
One extra query is made for each rendered heatmap.
Not displayed widgets are not queried 😉
Any meaningful update in Spider triggers a dashboard update:
- Time selection
- Filtering
- Widget selection
- Team or whisperer selection
- etc.
Provide feedback❗
Any missing widget?
Any feature you'd like?
Any bugs / appraisal / complaint?
Cheers,
Thibaut