Spider Controllers & Whisperers are of public access now
This was done in order to simplify usage of Spider.
This was done in order to simplify usage of Spider.
Spider now uses Google Sheet to store and manage access secrets used in local dev!
Sounds crazy? Read further!
Spider can now authenticate users with your favorite Identity Provider using OpenId Connect.

Setting up Spider on Kubernetes is now easier than ever with Spider Helmchart.
Depending on your architecture, Spider defaults settings may not be right.
When you are having big ingestion load with only few Whisperers... you may have a scaling issue!
Let's see how to overcome it!
Spider Plugin framework has been introduced in the beginning of year 2021.
This great feature enables to extend Spider by integrating business information into the technical data captured by Spider.
However great the feature is, it is not finished, and to make plugins available to Spider, you needed to have your own webserver and expose the files yourselves.
Spider now introduces its own Plugins Store, that allows users to upload plugins and make them available for everybody!
I introduced a shutdown delay on all microservices to postpone their shutdown.
Kubernetes control plane need this time to update the Load Balancer to tell it that the services get unreachable.
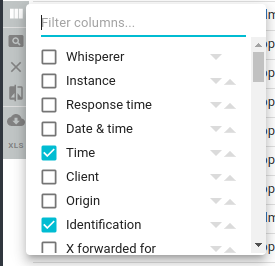
Upon Ophelien request, you may now filter columns in columns selection popin:

With Spider scaling with many teams and whisperers, it became easy to get lost on what team or whisperer was currently selected.
Trainings have revealed that something was missing!
I had the idea to integrate 'selected' badges left to filter badges!
You now have access to tags filter in the menu. No need to add them on the grid anymore to filter on tags.