65 posts tagged with "architecture"

View All Tags

Resiliency of Spider system under load :)

· 2 min read

Spider endured an unwanted Stress test this morning!

Thanks, it proved it behaved and allowed me to confirm one bug =)

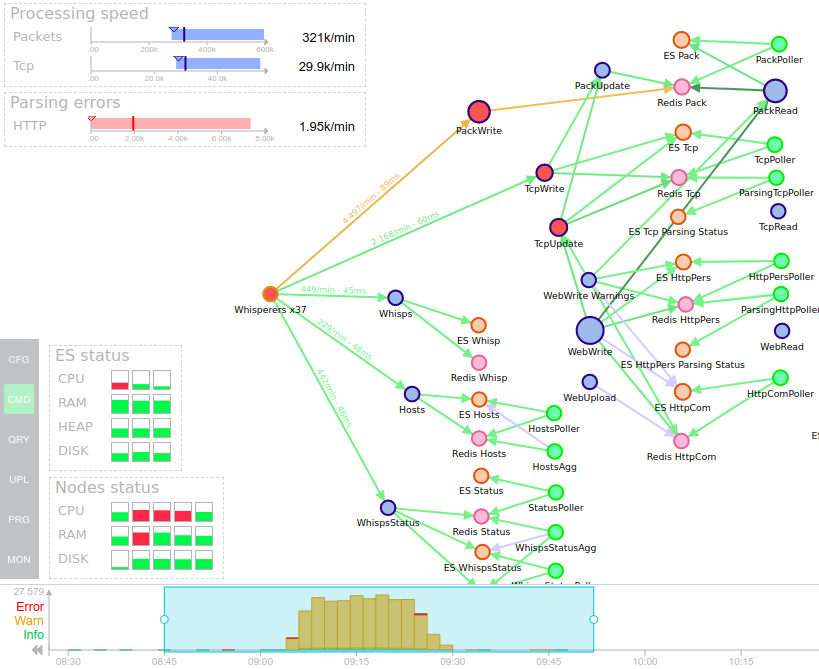
Look what I got from the monitoring:

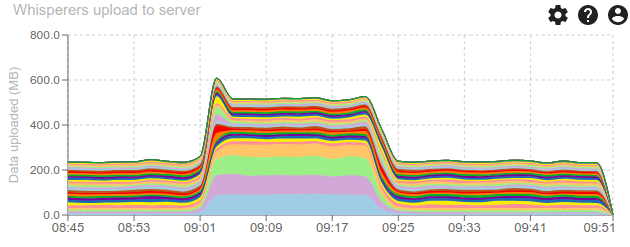
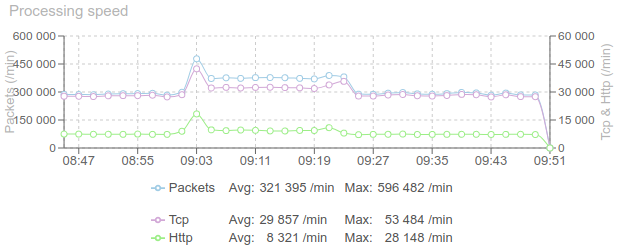
Load went from 290k/min to 380k/min between 9:00am to 9:20am:

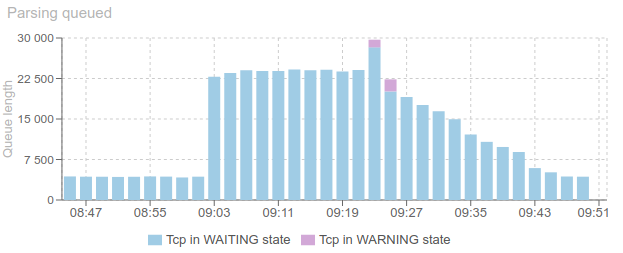
There were so many sessions at once to parsed that the parsing queue what hard to empty:

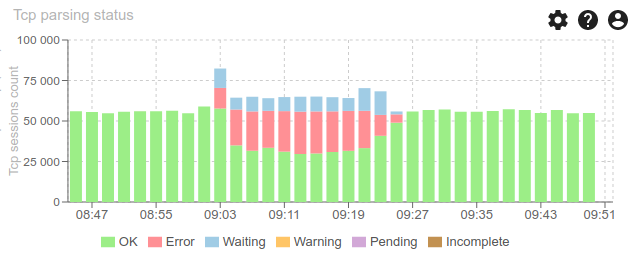
Thus generating many parsing errors, due to missing packets (short life time)

But all went back to normal afterwards :)

CPU and RAM were OK, so I bet the bottleneck was the configuration: limited number of parsers to absorb the load.

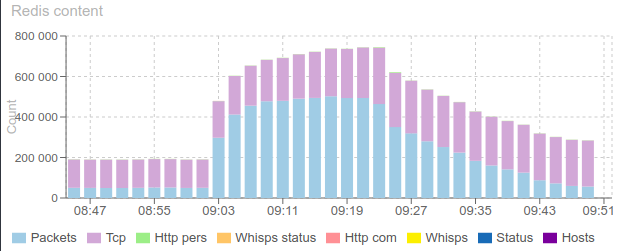
But there is a bug: Redis store does not get back to normal completely, some elements are staying in store and not deleted:

That will prevent the system from absorbing too many spikes like this in a row.

Also, some Circuit breakers to Redis opened during the spike (only 4...):

Under this load, the main two Redis instances were enduring 13k requests per second (26k/s combined), with a spike at 31k/s. For only ... 13% CPU each. Impressive!

And all this is due to a load test in SPT1 (the 4 whisperers at the bottom)

Conclusion:

  • System is resilient enough :)
  • Observability is great and important !!

Bonus: the summary dashboard:

  • A spike at 600k packets/min.
  • Many warnings in logs showing something got bad.
  • CPU on applicative node that went red for some time, and on an ES node as well.
  • Errors on 3 services that may not be scaled enough for this load.
  • And we see the circuit breakers errors due to Redis that suffered.

Really helpful!
Replicas reduction after perfomance optimisations

· 2 min read

I had a task that had been hanging around for months:

Reducing replicas and servers count as a consequence of all performance improvements.

Indeed, Spider cluster was still in a replicas configuration built when implementing in Node 8, with generators and using NGINX as gateway.

At this moment, I need many replicas to overcome some NGINX flaws under hi load within Docker. Except that now... The cluster is handling between 2x and 3x more load, and constantly!

So I did the work of computing theoretical replicas count, and reducing them until it felt reasonable.

Overall results​

And the result is great:

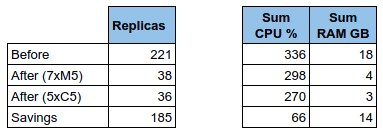
  • From 221 cumulated replicas on operational services,
  • It got reduced to... 36 ! :) I removed 185 replicas from the cluster!

Globaly, it is interesting to note that removing replicas:

  • Reduced drastically the RAM usage, which was the goal: - 14GB
  • Decreased alos the total CPU usage.
    • I think this is due to less CPU overhead in changing process

Thanks to the memory reduction, I moved from x7 M5 AWS instances to x5 C5, which are cheaper for better CPU (only 4 GB of RAM). I may remove one server still, because the average load is 90% CPU and 2 GB of RAM. But I'll wait some time to be sure.

Detailed step by step​

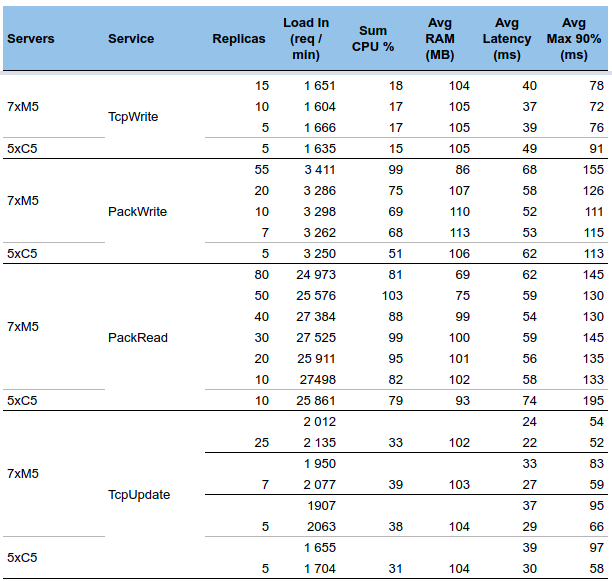
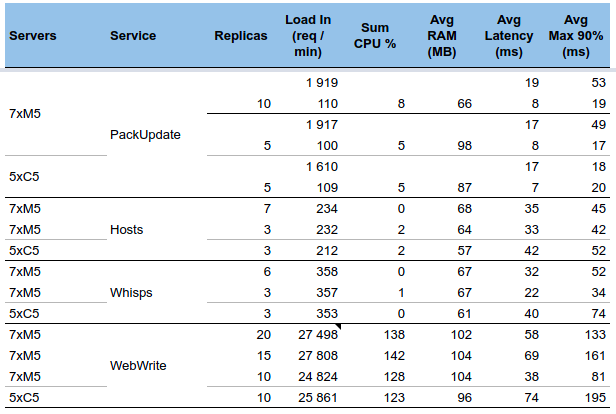
Replica reduction was made step by step, and metrics saved for each step.

  • You may notice that reducing replicas made services faster !! This couls be linked to the removal of context changes...
  • And then, moving from 7 servers to 5 servers increase the latency again. For sure... when a server does almost nothing, it is fastest ;-)
    • There was also an intermediate step, not on this table, with 7xC5. But latency almost did not change.

Traefik issue​

After reducing replicas, I encountered a strange issue:

There were some sporadic 502 error messages from one service calling another one. But the error message was captured in the caller, the callee did not receive the communications!

And indeed, the issue was in Traefik gateway. The case is not so frequent, but it is due to the big difference of socket timeout between Traefik and Node. Traefik is at 90s, Node... at 5s. Once Node TTL is configured longer that Traefik's the 502 disappeared. Reference: https://github.com/containous/traefik/issues/3237

New saving options - TcpSessions and Http parsing resources - leading to a huge optimisation !

· 2 min read

New saving options​

Due to upgrade to Redis 5.0.7, a bug that I'd been tracking for months has been solved (on Redis ;) ), and now parsing quality is 100% :-) apart from clients issues.

Then I moved to next phase: it is possible not to save parsing resources any more, thus leading to a huge optimisation in Elasticsearch usage...

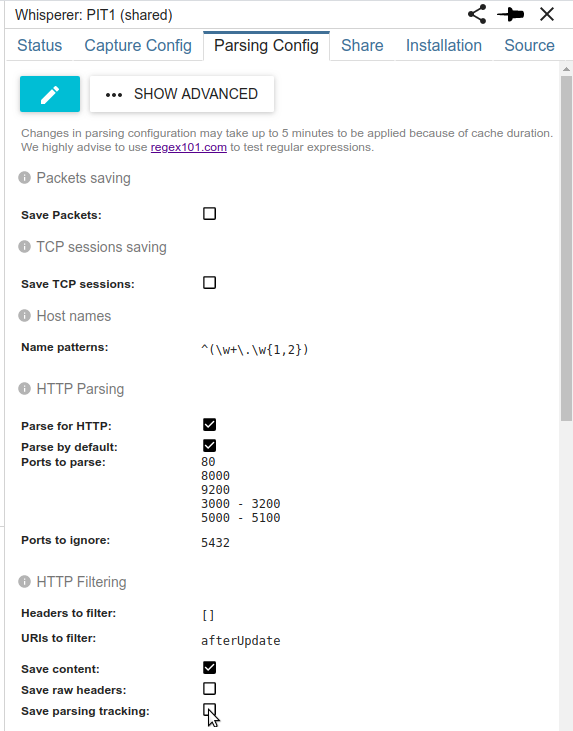
For this, I recently added two new options in Whisperer configuration:

  • Save Tcpsessions
  • Save Http parsing resources

No need to save those?​

As for most cases, at least on Streetsmart, we do not work with Tcp sessions and Http parsing resources, there is no use to save them in Elasticsearch.

  • These resources are indeed only used to track parsing quality and to troubleshoot specific errors.
  • These resources are also saved on Elasticsearch for recovery on errors... but as there are no more errors... it is completely possible to avoid their storage.

I had to change the serialization logic in different places, but after a couple of days, it is now stable and working perfectly :)

The whole process of packets parsing is then done in memory, in real time and distributed across many web services in the cluster, using only Redis as a temporary store, moving around 300 000 packets by minute 24h/24, amounting to almost 100MB par minute!

That's beautiful =)

What's the result?​

  • Less storage cost
  • Less CPU cost for Elasticsearch indexation
  • More availability for Elasticsearch on the UI searches :-) You must have noticed less timeouts these days?

On UI, when these resources are not available, their hypermedia links are not shown. And a new warning is displayed when moving to TCP / Packet view:

Currently, Tcp sessions and Packets are only saved on SIT1 and PRM Integration platforms. For... non regression ;)

One drawback though​

Those resources where rolled up in Elasticsearch to provide information for the parsing quality line at the bottom of the timeline. :-/

As I got this evolution idea AFTER the quality line implementation, I have nothing to replace it yet. So I designed a new way to save parsing quality information during the parsing, in a pre-aggregated format. Development will start soon!

It is important for transparency as well as non regression checks.

Upload Whisperers now have their own storage rules, and purge is back :)

· One min read

Thanks to Leo, we just found out that recent evolution with Index Lifecycle Management had removed the possibility to purge the data manually uploaded to Spider.

I then changed a bit the serialization and storage architecture so that Upload Whisperers have dedicated indices and lifecycles.

Thanks to index templates inheritance and a clever move on the pollers configuration, the changes where pretty limited :)

So now:

  • Uploaded data are kept for several weeks.
  • Uploaded data can be purged whenever you don't need them anymore

Small change, big effects - MTU setting in Docker overlay network

· One min read

Hi,

Thanks to Pawel who shared me this link: https://github.com/moby/moby/issues/37855, I tried and changed the MTU settings of Spider internal cluster overlay network.

docker network create spider --driver overlay --subnet=10.0.0.0/16 --opt com.docker.network.driver.mtu=8000

It's only like two words to add to the network settings, but it requires you to restart the full cluster (which I don't do anymore very often ;)).

And the effet was immediate:

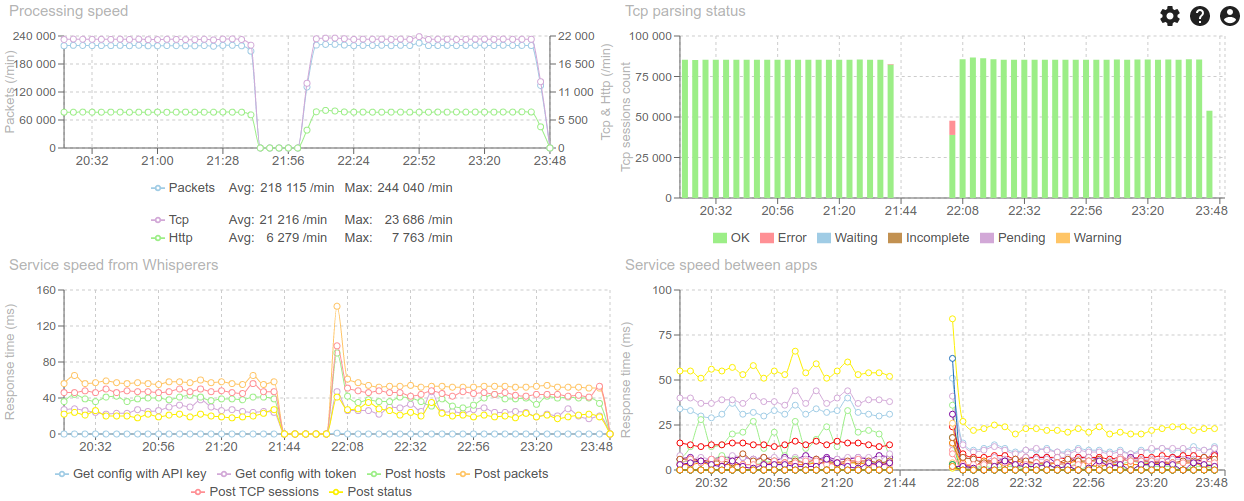
  • Around 50% faster intra cluster exchanges
    • See graphic on the bottom right
    • Other graphs show that load is the same and quality of parsing the same as well.

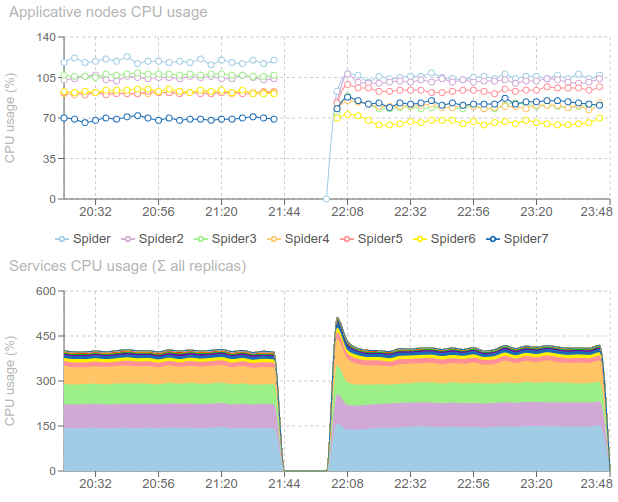
  • Around 10% less CPU usages on cluster nodes
    • But not that there is no change in service CPU usage: Docker daemon is using less CPU

Man, small change, big effect !! Why isn't this documented in Docker docs ?!

Thibaut


Btw, in the 15min outage, I had time to:

  • Upgrade Docker, and security packages of all servers
  • Upgrade Elasticsearch, Kibana and Metricbeat ;)

Thanks for compatible versions =)

Index Lifecycle Management

· One min read

I recently added index lifecycle management principles in Spider.

The data usage of the cluster has been reduced greatly with index shrinking and merging. Worth it :)

Moving from Pets to Cattle

· 2 min read

Whisperers have moved from Pets to Cattle :-)

Previously each Whisperer needed to have its own configuration and was launched independently. If many Whisperers had the same configuration, there would be conflicts in parsing.

Now, Whisperers can have many instances sharing the same configuration. For instance, on Streetsmart, instead of having one Whisperer for each gateway in the cluster, there is one instance of the same Whisperer attached to each gateway.

  • Setup is simple
  • Configuration is simpler
  • Usage is simpler (only one Whisperer to select in UI / API)
  • UI speed is also faster, thanks to Whisperer based data sharding, and some preaggregation
  • And it is opening the usage of Whisperers inside Kubernetes pods ;-)

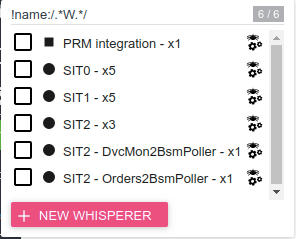
Whisperer selection now looks like:

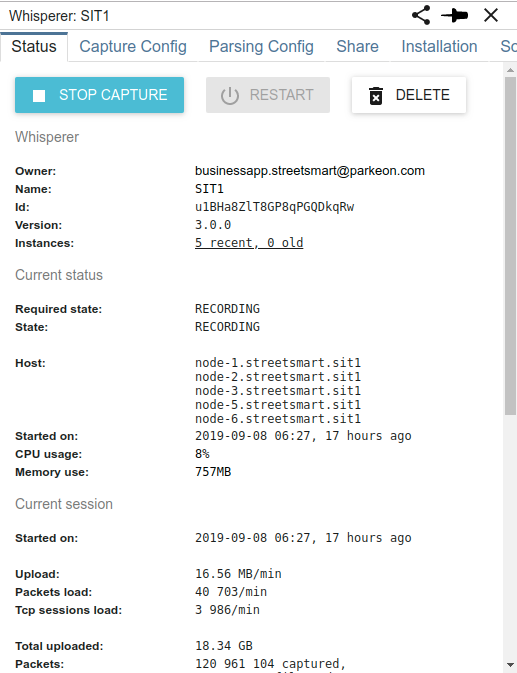
To see one environment, you only need to select SIT1 Whisperer, and you will see all communications from all its instances. The instances count is displayed next to the Whisperer name.

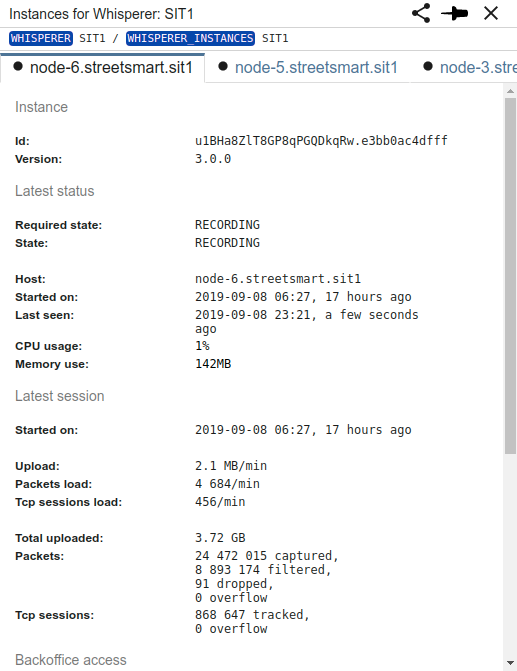
Whisperers instances status are merged into one: Clicking on the instances link gives the status of each Whisperer instance:

The name resolution tracked by each Whisperer instance are also aggregated into one in the backoffice, in order to fasten UI operations and name resolution of nodes.

This change required a big rework of the data architecture of Spider. Everything seems to work good and safe, but if you notice any weird behavior or bug, please keep me informed :-)

I hope you'll like it!

Checking ES indices on start

· One min read

I added a check on all services startup: when they connect to Elasticsearch, they check that the expected indices or aliases exist.

=> It avoids compromising Elasticsearch indices with automated created ones, and warns from incomplete installation.

Improved rollup for TCP session parsing status

· One min read

With latest Node.js Elasticsearch client, I was able to integrate Rollup search feature to Spider:

  • The parsing status is pre aggregated after 5 minutes in a rolled up index
  • The monitoring UI is then using both this rolled up index and latest active temporal index of Tcp Sessions to display the status Timeline

The result is much faster: 400ms for 5 days histogram instead of more than 8s.

Tips to use Rollup feature:

  • Use fixed interval in rollup job. Not '1m', but '60s'.
  • Use autogenerated index from ES, not a custom one (as I tried ;) )

Migration to Elasticsearch 7

· One min read

Spider has been migrated to latest Elasticsearch version to date: 7.2. With it comes many advantages as:

  • Confirmed RollUp API
  • Index lifecycle management
  • SQL interface
  • More and more Kibana features
  • Performance improvements

The migration was long and a bit painful: there have been many breaking changes in scripts and in the ES node.js library.

The more painful being that ES indices created in version 5 block ES7 from starting.... But it is then impossible to go back to version 6 to open and migrate them: the cluster is partially migrated :( I had to copy the indices file to a local ES6 installation and perform a remote reindex to recover the data in the cluster.

Finally, it is ready and running. And all search API have got a new parameter: avoidTotalHits, that avoid computing the total number of hits in the search response, which make searching a bit faster.