Alerting
Spider supports only alerting by sending email for now.
This should be quite enough most of the time since Spider being down is not preventing you from running your system. You should not want Spider to wak you in the middle of the night when it is having issues.
However, Spider having been battle tested for years, alerts are worth checking, as they may underpin an issue in the system under observation.
Architecture
Microservice
Alerting in Spider is managed by alert microservice.
Dependencies
Hard
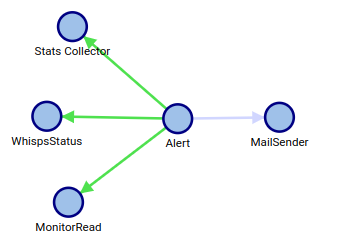
Alert service depends on:
Mailsenderservice to send... mails
If MailSender service is not running or badly configured... you won't receive any alert.
Lose
Depending on the probes, Alert service may call:
Monitor-Readservice to get monitoring informationWhisps-Statusservice to get whisperers running informationStats-Collectorservice to get licence statsElasticsearchandRedisstores to check their availability
How does alerting work?
Algorithm
For all probes defined in configuration, the service launches an asynchronous worker that will run the probe and send mails depending on the probe result and lifecycle.
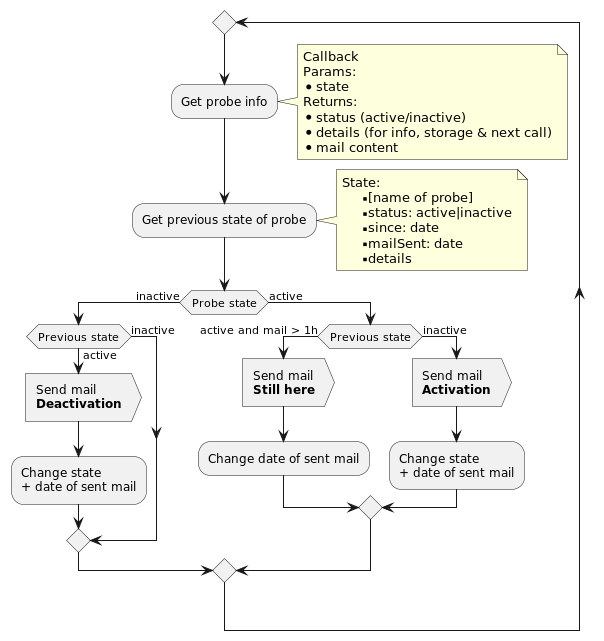
- Currently, as soon as as probe gets
active(failure), a mail is sent. - Another mail is sent every hour if the probe stays
active. - A 'clearing' mail is sent when the probe gets
inactivewhen the situaton is solved.
Delays
Two delays are defined by default for each probe
  "delayWhenInactive": "PT5M",
  "delayWhenActive": "PT1M"
delayWhenInactive- sets the frequency of running the probe when the probe state isinactivedelayWhenInactive- sets the frequency of running the probe when the probe state isactive
When the probe is active - ie. it is in error state - it polls more frequently, to check if the system healed.
For now, overriding these delay is not possible in setup.yml.
If needed, you'll have to adapt the template in 1_templates\2_config\apps\alert.cfg.json.
Alert mail
Structure
Alert emails contains:
- The name, status and date of change of the probe in the subject
- Details on the probe state when in
activein the body

Alert email bodies are in json
They can be post processed by automated flows, like by using AWS Lambda.
Standard fields
The json body includes various standard fields
    "endpoint": "https://...",
    "name": "tooManyLogs",
    "status": "ACTIVE",
    "since": "2023-04-07T09:39:57.475Z",
| Field | Description |
|---|---|
| endpoint | URL where spider is located. To allow differentiating many installations |
| name | Name of the probe |
| status | Status of the probe |
| since | Date of change of state |
Alert metrics
The Alert service exposes a /metrics API in Prometheus format.
It may be used to capture the alerts in your own way and react in consequence.
- The metrics are the one used to trigger the alerts.
- They are not the raw metrics from Spider, neither the status of the alert.
- You need to use the thresholds from configuration (or use your own) to trigger your own alerts.
Should you want access to the raw metrics, you may access them with Spider REST API.
They are not yet exposed in Prometheus format.
Sample of output:
# HELP spider_logs_errors_per_min Tells how many error logs per min have been emitted over the last minutes
# TYPE spider_logs_errors_per_min gauge
spider_logs_errors_per_min 5

# HELP spider_whisperers_status_per_min Tells how many whisperers status are received per min
# TYPE spider_whisperers_status_per_min gauge
spider_whisperers_status_per_min 126

# HELP spider_elasticsearch_disk_free_space_bytes Tells Elasticsearch nodes free storage
# TYPE spider_elasticsearch_disk_free_space_bytes gauge
spider_elasticsearch_disk_free_space_bytes{node="elasticsearch-es-default-0"} 116.267578125
spider_elasticsearch_disk_free_space_bytes{node="elasticsearch-es-default-3"} 297.740234375
spider_elasticsearch_disk_free_space_bytes{node="elasticsearch-es-default-1"} 558.912109375
spider_elasticsearch_disk_free_space_bytes{node="elasticsearch-es-default-2"} 345.0810546875

# HELP spider_elasticsearch_valid_info Tells if Elasticsearch status is valid. Green/Yellow: 1 - Red: 0 - Unknown: -1
# TYPE spider_elasticsearch_valid_info gauge
spider_elasticsearch_valid_info{cluster="elasticsearch"} 0

# HELP spider_elasticsearch_active_shards_ratio Tells percent of active shards in the cluster. Should be 1.
# TYPE spider_elasticsearch_active_shards_ratio gauge
spider_elasticsearch_active_shards_ratio{cluster="elasticsearch"} 99.64788732394366

# HELP spider_redis_free_memory_bytes Tells Redis free memory for each Redis store used
# TYPE spider_redis_free_memory_bytes gauge
spider_redis_free_memory_bytes{node="redis-pack"} 542945280
spider_redis_free_memory_bytes{node="redis-shared"} 972849152
spider_redis_free_memory_bytes{node="redis-tcp"} 765820928

# HELP spider_parsing_delay_seconds Tells the greatest percentile 95 of parsing delay over the period.
# TYPE spider_parsing_delay_seconds gauge
spider_parsing_delay_seconds{parser="WebWrite"} 14.475

# HELP spider_license_valid_info Tells if license is valid or not
# TYPE spider_license_valid_info gauge
spider_license_valid_info 1

# HELP spider_license_expiration_seconds Tells in how many seconds license will expire
# TYPE spider_license_expiration_seconds gauge
spider_license_expiration_seconds 21266347636

# HELP spider_license_last_sent_stats_seconds Tells how long since last stats were sent to central Floocus server
# TYPE spider_license_last_sent_stats_seconds gauge
spider_license_last_sent_stats_seconds 1687894490

# HELP spider_polling_queue_count Tells how many items are stored in the queue, waiting for parsing.
# TYPE spider_polling_queue_count gauge
spider_polling_queue_count{queue="CaptureStatusPoller"} 0
spider_polling_queue_count{queue="HostsAgg"} 1
spider_polling_queue_count{queue="HostsPoller"} 12
spider_polling_queue_count{queue="HttpComContentPoller"} 659
spider_polling_queue_count{queue="HttpComPoller"} 286
spider_polling_queue_count{queue="HttpPersPoller"} 0
spider_polling_queue_count{queue="PackPoller"} 0
spider_polling_queue_count{queue="ParsingStatusHttpPersPoller"} 24
spider_polling_queue_count{queue="ParsingStatusTcpSessionPoller"} 138
spider_polling_queue_count{queue="StatusPoller"} 27
spider_polling_queue_count{queue="TcpPoller"} 0
spider_polling_queue_count{queue="WhispsStatusAgg"} 4
spider_polling_queue_count{queue="WhispsStatusPoller"} 38
Gauges will output
- -1 or -2 when status is unknown
- 0 at start
Info gauges (for Elasticsearch and license) values are:
- 0 for false / invalid
- 1 for true / valid
Health API
Spider exposes a /health API.
It exposed, in JSON, a global status including all probes current status at the moment of the call.
For each probe, are listed:
- the status
- since when the status has the same value
- last time the probe was run
This API is open and may not be subject to authentication.
- It is meant to be used for external monitoring or health page.
- It is used by Self Monitoring UI in the summary page.
- You may activate authentication or not of this API in API options section of the
values.yamlsetup file
{
  "license": {
    "name": "{your company} build factory",
    "expires": "2024-12-31"
  },
  "endpoint": "https://spider.yourCompany.io",
  "probes": {
    "tooManyLogs": {
      "status": "INACTIVE",
      "statusSince": "2024-01-28T16:18:01.127Z",
      "lastChecked": "2024-01-28T21:14:02.275Z"
    },
    "noNewStatus": {
      "status": "INACTIVE",
      "statusSince": "2024-01-28T16:18:01.128Z",
      "lastChecked": "2024-01-28T21:14:01.818Z"
    },
    "infraChange": {
      "status": "INACTIVE",
      "statusSince": "2024-01-28T16:18:01.129Z",
      "lastChecked": "2024-01-28T21:14:01.988Z"
    },
    "lowESFreeSpace": {
      "status": "INACTIVE",
      "statusSince": "2024-01-28T16:18:01.129Z",
      "lastChecked": "2024-01-28T21:14:01.987Z"
    },
    "healthcheckES": {
      "status": "INACTIVE",
      "statusSince": "2024-01-28T16:18:01.130Z",
      "lastChecked": "2024-01-28T18:44:01.370Z"
    },
    "healthcheckRedis": {
      "status": "INACTIVE",
      "statusSince": "2024-01-28T16:18:01.277Z",
      "lastChecked": "2024-01-28T21:14:01.678Z"
    },
    "parsingDelay": {
      "status": "INACTIVE",
      "statusSince": "2024-01-28T16:18:01.278Z",
      "lastChecked": "2024-01-28T21:14:02.012Z"
    },
    "licenseInvalid": {
      "status": "INACTIVE",
      "statusSince": "2024-01-28T16:18:01.278Z",
      "lastChecked": "2024-01-28T16:18:01.278Z"
    },
    "oldLicenseStats": {
      "status": "INACTIVE",
      "statusSince": "2024-01-28T16:18:01.279Z",
      "lastChecked": "2024-01-28T20:19:01.318Z"
    },
    "pollingQueued": {
      "status": "INACTIVE",
      "statusSince": "2024-01-28T16:18:01.280Z",
      "lastChecked": "2024-01-28T21:14:02.057Z"
    }
  }
}
Configuration
Alerting configuration is done in Spider setup.yaml file.
First, you have to configure the support email addresses that will be notified:
customers:
  supportEmails:
    - spider-admins@yopmail.com
Then you have to setup a valid SMTP configuration:
smtp:
  # email used to send mails
  email: spider.analyzer@yopmail.com
  # smtp server to use
  server: smtp.my-company.com
  # port of smtp server
  port: 465
  # is smtp server secured
  secure: true
  ignoreTLS: false
  # login and password to use of smtp server is secured
  loginAuth:
    login: ...
    password: ...
  # oAuth options, if smtp server requires oAuth (gmail does)
  oAuth:
    user:
    clientId:
    clientSecret:
    accessToken:
    refreshToken:
    expires: 3600
Then, for each alert, you may:
- activate it or not
- alerts jobs are always running in order to expose their metrics for prometheus and the UI
- however, an
activealert is going to send mail, when an inactive will not
- define thresholds values specific to it
alerting:
  tooManyLogs: # Alerts when last minutes are showing too many errors
    active: true
    maxErrorLogsPerMin: 10
  noNewStatus: # Alerts when Whisperers are not sending anything
    active: true
    minStatusPerMin: 5
  # etc.
Existing alerts
Each alert is described in more details in the linked pages:
| Name | Description |
|---|---|
| tooManyLogs | Alerts when last minutes are showing too many errors |
| stuckGocipher | Alerts when a gocipher is persistently failing to send TLS secrets |
| noNewStatus | Alerts when Whisperers are not sending anything |
| infraChange | Alerts when servers are added / removed |
| lowESFreeSpace | Alerts when ES is getting low free space |
| healthcheckES | Alerts when ES health is yellow or red |
| healthcheckRedis | Alerts when the free memory in Redis gets too low |
| parsingDelay | Alerts when the delay for parsing gets too long |
| licenseInvalid | Alerts when license is getting invalid in the month |
| oldLicenseStats | Alerts when license stats are too old |
| pollingQueued | Alerts when too many items are in the queues |