UI usage
Description
This dashboard provides statistics on Spider UI usage: Connected client over time, Usage statistics, Users statistics, Session history and Actions usage.
This dashboard has a different timescale as the others. Indeed, the UI tracking records are not purged at the same time as all other operational data. You can choose on the time scale to display:
- Actions
- Sessions
- Jobs (purges & uploads)
Screenshot
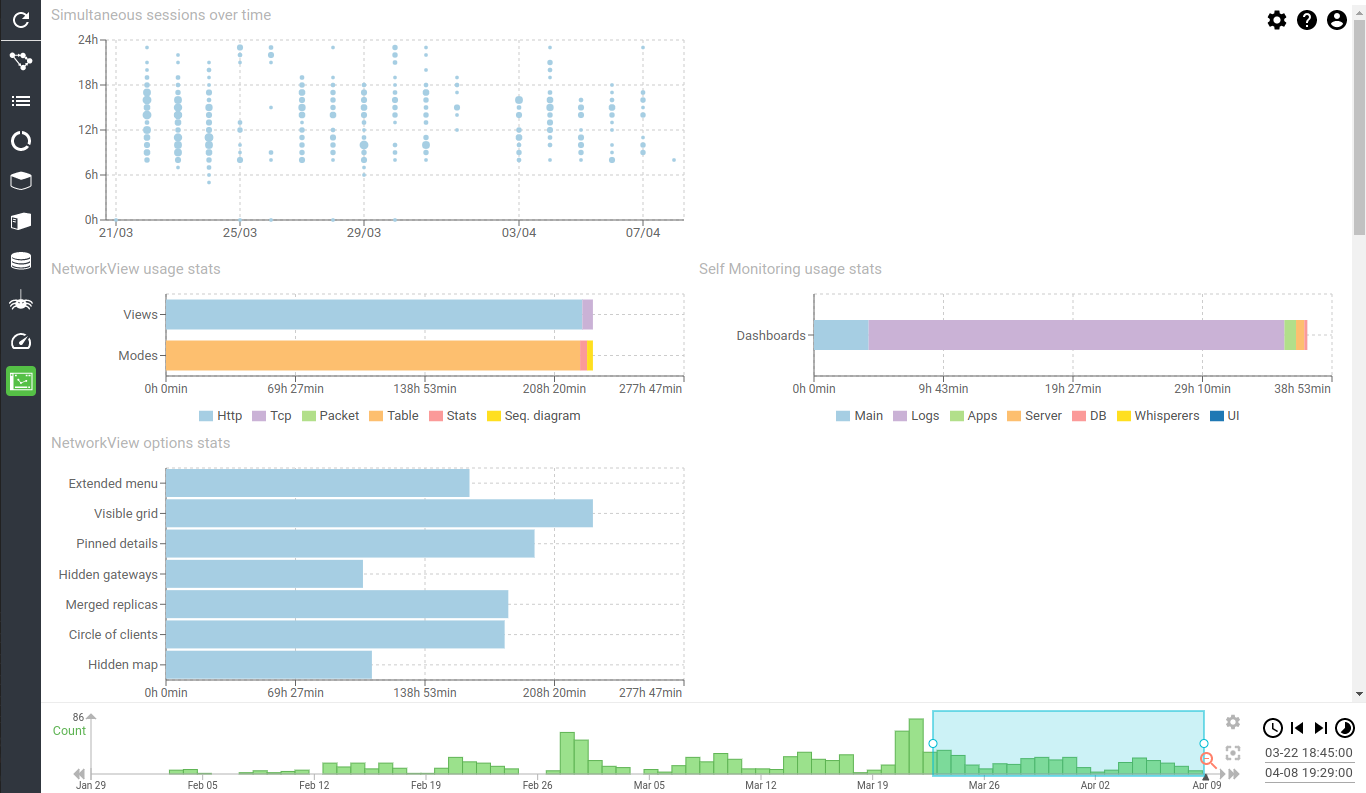
Content
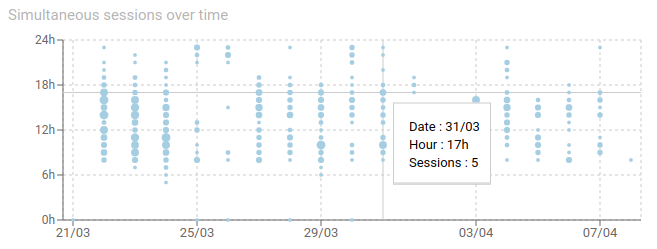
Simultaneous sessions over time (chart)
Tracks the number of simultaneous connected users using on Spider UI over time.
- X axis: days
- Y axis: hours
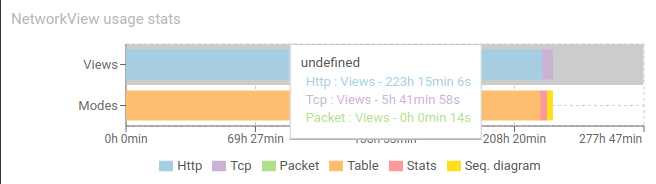
Network view usage stats - aggregated chart
Shows distribution of Spider UI Views usage and Modes on selected time.
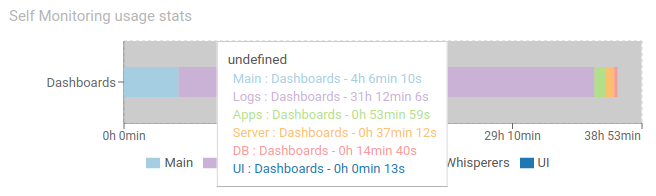
Self Monitoring usage stats - aggregated chart
Shows distribution of monitoring views usage on selected time.
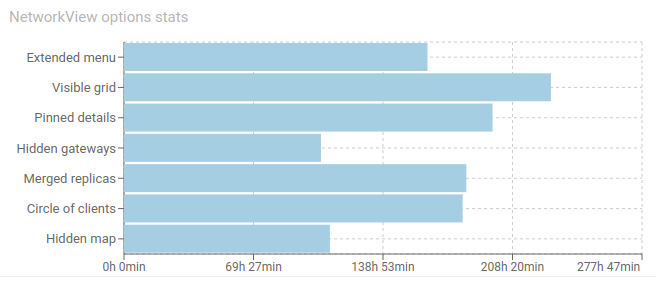
NetworkView options stats - aggregated chart
Shows distribution of options usage of NetworkView
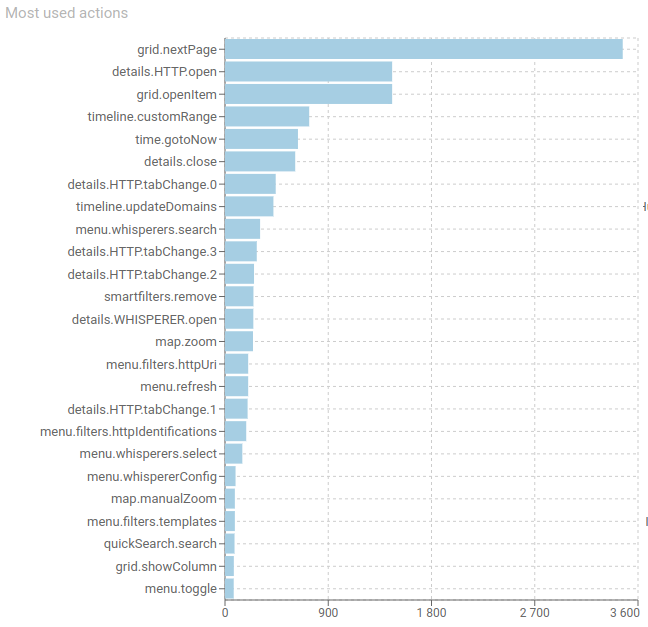
Most used actions - aggregated chart
Shows most used actions in the UI.
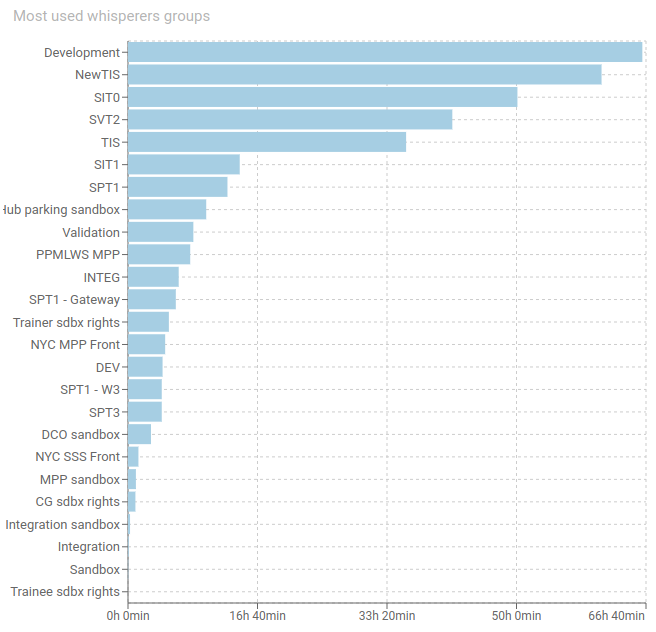
Most used Whisperers groups - aggregated chart
Shows most used Whisperers groups (by time)
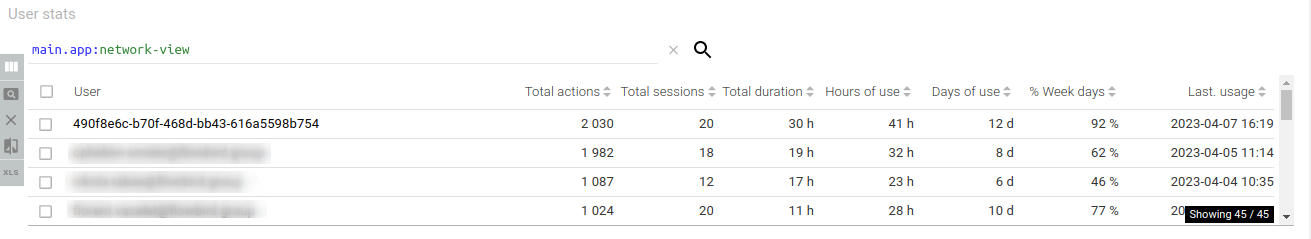
User stats - aggregated grid
Lists each users usage statistics of the UI over the selected period
- Total actions
- Total duration of sessions
- Total hours of usage (each hour started counts)
- Total count of days of usage
- % of working day usage (sundays and saturdays are removed from reference)
- Last usage date and time
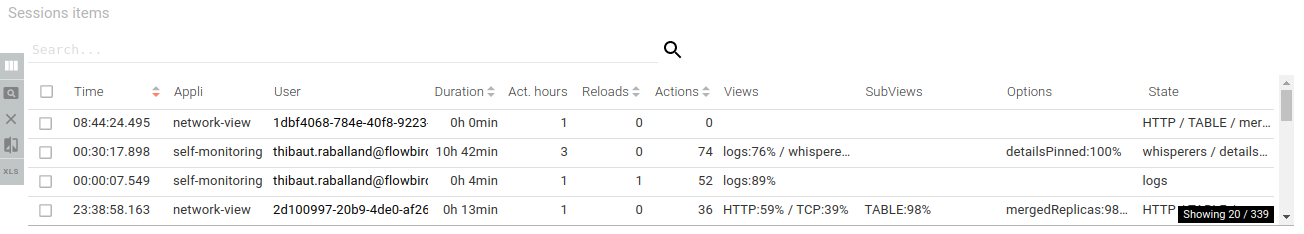
Session items - items grid
Lists users sessions items
Preconfigured to display:
- Start time of session
- Application
- User
- Duration of session
- Active hours
- Browser reloads count
- Actions count
- % spent on each view
- % spent on each mode/subview
- % spent on each options
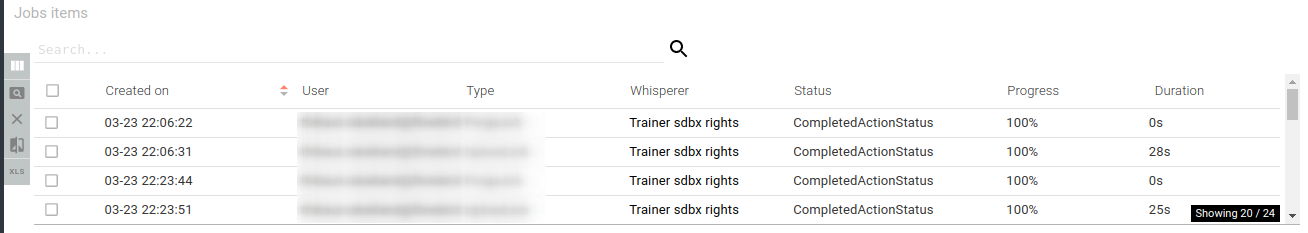
Upload and purge items - items grid
Lists frontend / backend jobs triggered by users
- Purges
- Uploads (Pcap and Json export)
- Downloads
Preconfigured to display
- Date of creation
- Job type
- Whisperer used
- Status of action
- Progress
- Duration of job