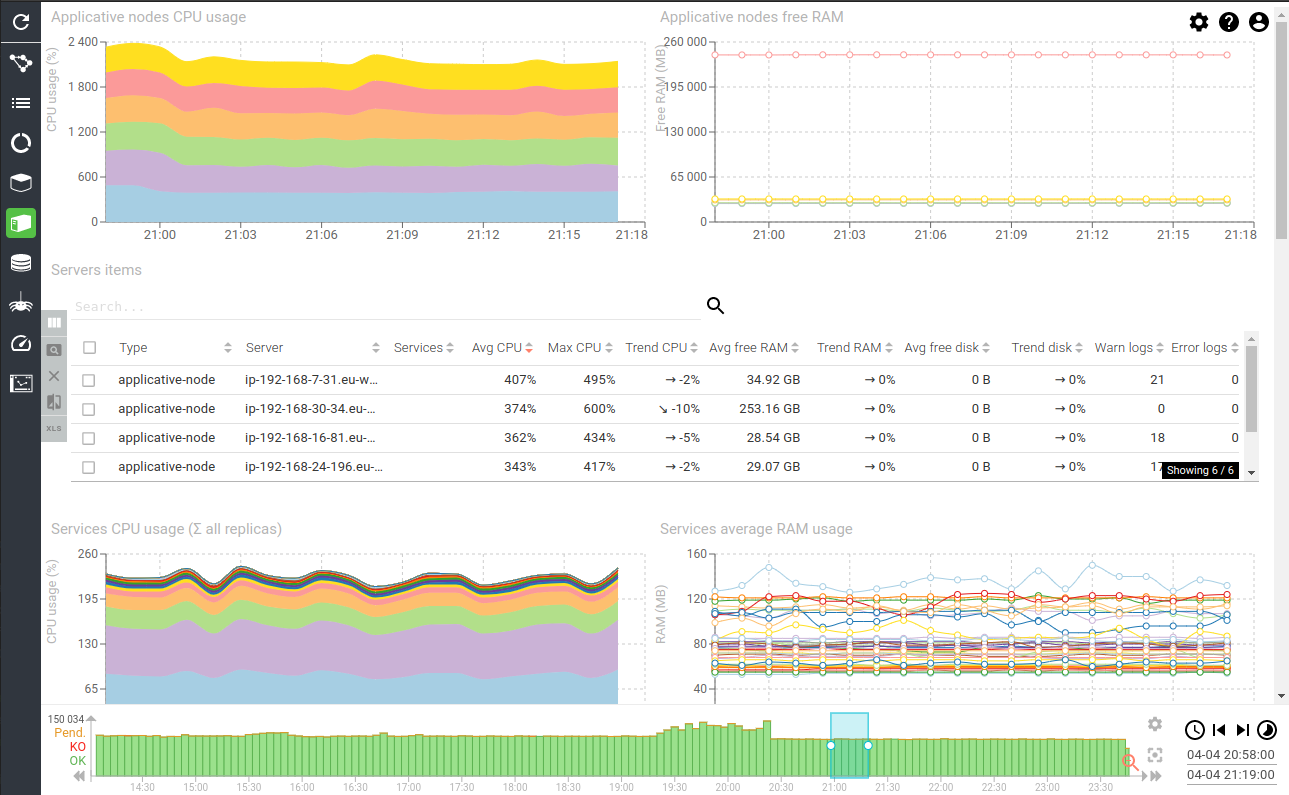
Servers status
Description
This dashboard provides a status of the servers hosting the cluster and its datastores: CPU, RAM, Disk…
Screenshot
Content
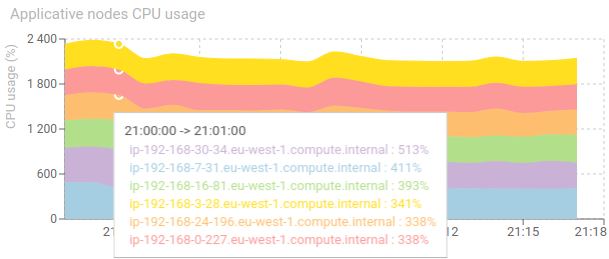
Applicative nodes CPU usage - timed graph
Shows the CPU usage of each node involved in the applicative cluster.
- Can be above 100% when multiple cores
- Stability is key
- Same usage on each node is preferred
- Target is below 75% * number of cores
When using Kubernetes, Spider would not be the only one running in the Cluster. This graphs shows the CPU used by all applications running, on all nodes.
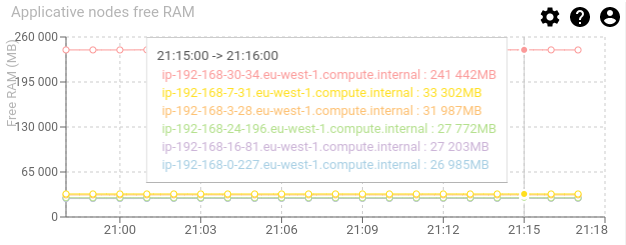
Applicative nodes free RAM - timed graph
Shows the free RAM usage of each node involved in the applicative cluster.
- This includes the operating system caching mechanism, so free RAM could be rather low
- Stability is better
- Same usage on each node is preferred
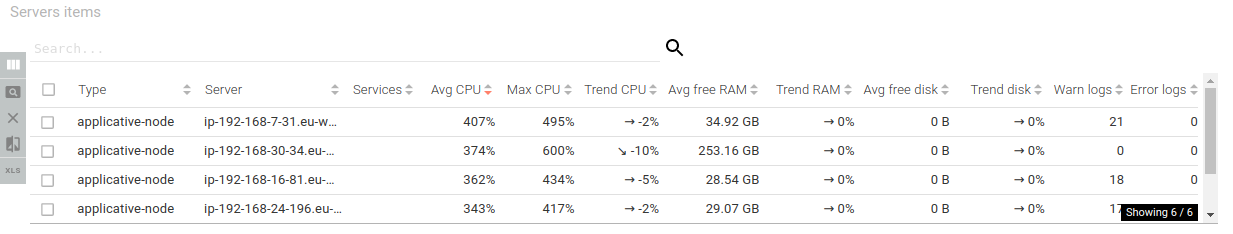
Servers items - aggregated grid
Shows major metrics for each cluster node, and their trend:
- CPU
- RAM
- Disk (when on Swarm)
- Count of warn and errors logs
This grid is for factual figures and mainly designed to export data.
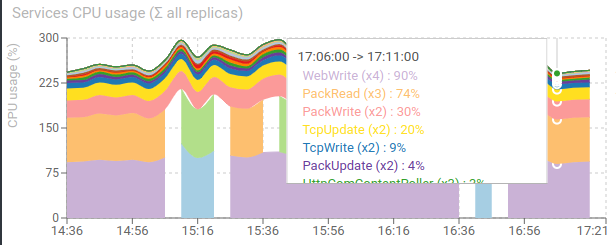
Services CPU usage (sum of all replicas) - timed graph
Shows the CPU usage sum of all replicas for each service
- Allows to find most demanding services easily and scale them
- Allows to track weird behaviors
We can see that the most used ones are:
- WebWrite that aggregates packets of a TCP session and parses it
- PackRead that gives packets to WebWrite
- PackWrite that receives and parse Packets from Whisperers
- TcpUpdate that provides TCP sessions to parse and updates them after each parsing
- TcpWrite that receives TCP sessions from Whisperers
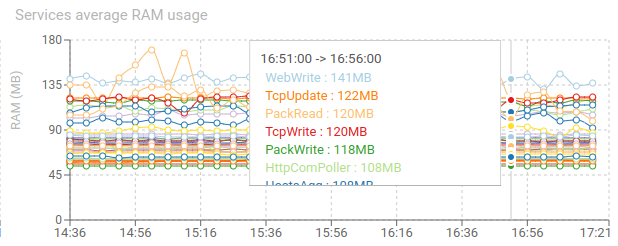
Services average RAM usage - timed graph
Shows the average RAM usage of all replicas for each service
- Most services are using between 90 and 150 MB of RAM per replica
- Stability is the target
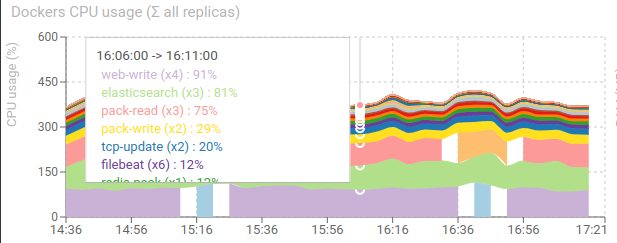
Dockers CPU usage (sum of all replicas) - timed graph
Shows the CPU usage sum of all Dockers for each service.
It provides a view on the cluster usage without limiting to services. You'll also find:
- Elasticsearch
- Redis
- Traefik
- Metricbeat
- Filebeat
It allows to see any unexpected usage.
For instance, Filebeat is using a lot of CPU, because we have one for each node, and it tracks all logs, even not Spider's.
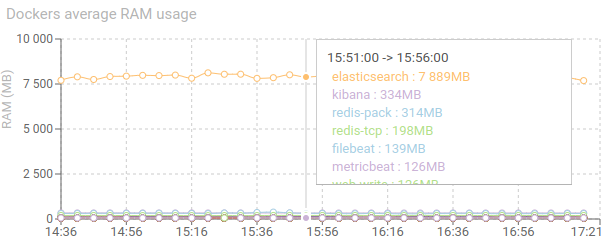
Dockers average RAM usage - timed graph
Shows the average RAM usage of all Dockers for each service.
Without surprise, Elasticsearch outranges all others.
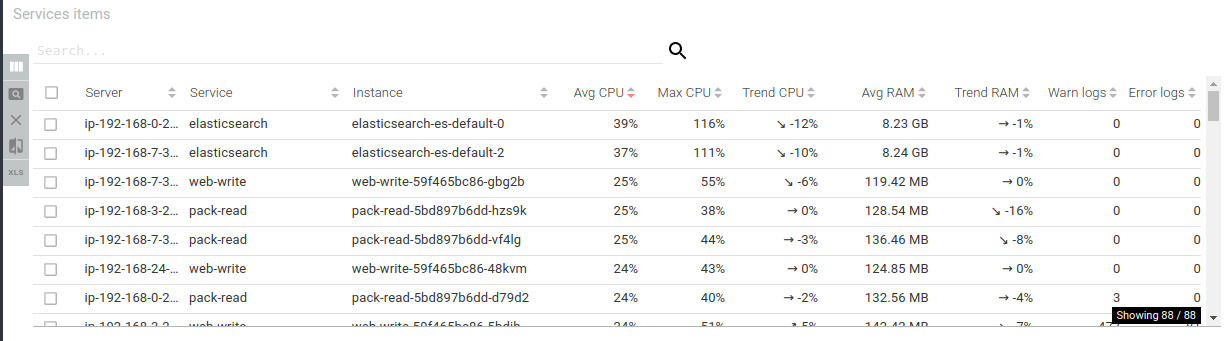
Services items - aggregated grid
Shows major metrics for each service instance / pod, and their trend:
- CPU
- RAM
- Count of warn and errors logs
This grid is for factual figures and mainly designed to export data.
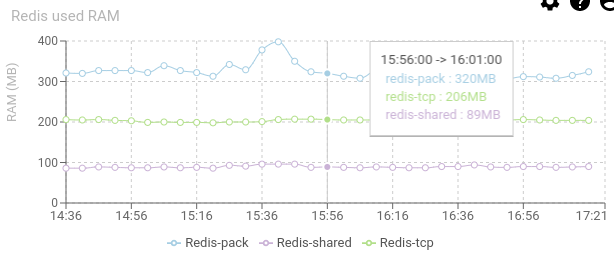
Redis used RAM - timed graph
Shows the memory usage of Redis over time.
- When the processing of pollers and parsing is too slow, Redis accumulates data and can reach its maximum (1GB for default)
- The more stable the better.
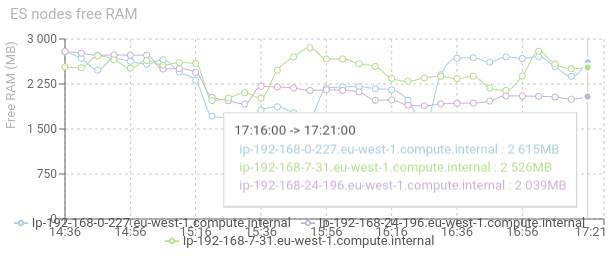
ES nodes free RAM - timed graph
Show the free RAM for each Elasticsearch node / pod.
- The lower, the better.
- The more stable the better.
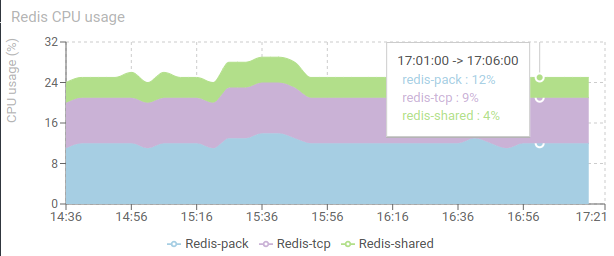
Redis CPU usage - timed graph
Shows the CPU usage of Redis databases instances.
- Nothing special to say... it is so small!
- Usually, I noticed a proportional ratio of 1% CPU for 1000 req/s load.
- The number of instances and what they hosts is configurable
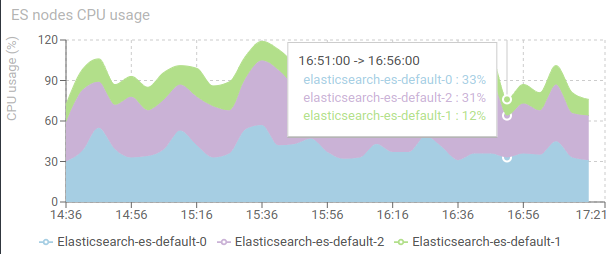
ES nodes CPU usage - timed graph
Shows the CPU usage of Elasticsearch inside each node / Pod of Elasticsearch cluster.
- Maximum at 100% for each node.
- Stability is a key
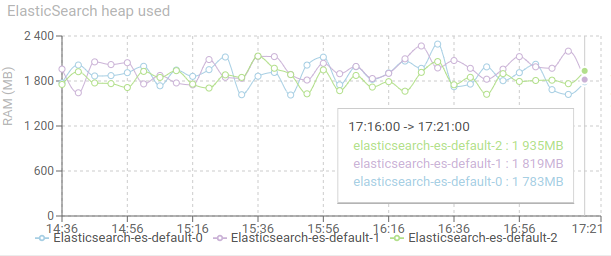
Elasticsearch heap used - timed graph
Shows the JVM Heap used of Elasticsearch on each node.
- Should not reach the limit (configurable)
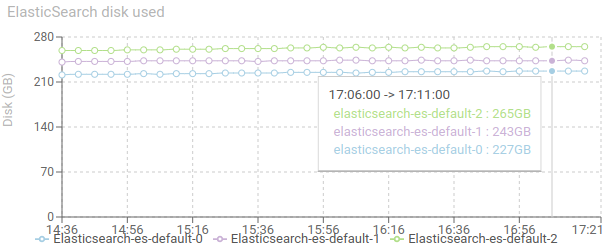
Elasticsearch disk used - timed graph
Shows the disk used on each ES node.
- Should not reach the limit (configurable)