Status summary
Description
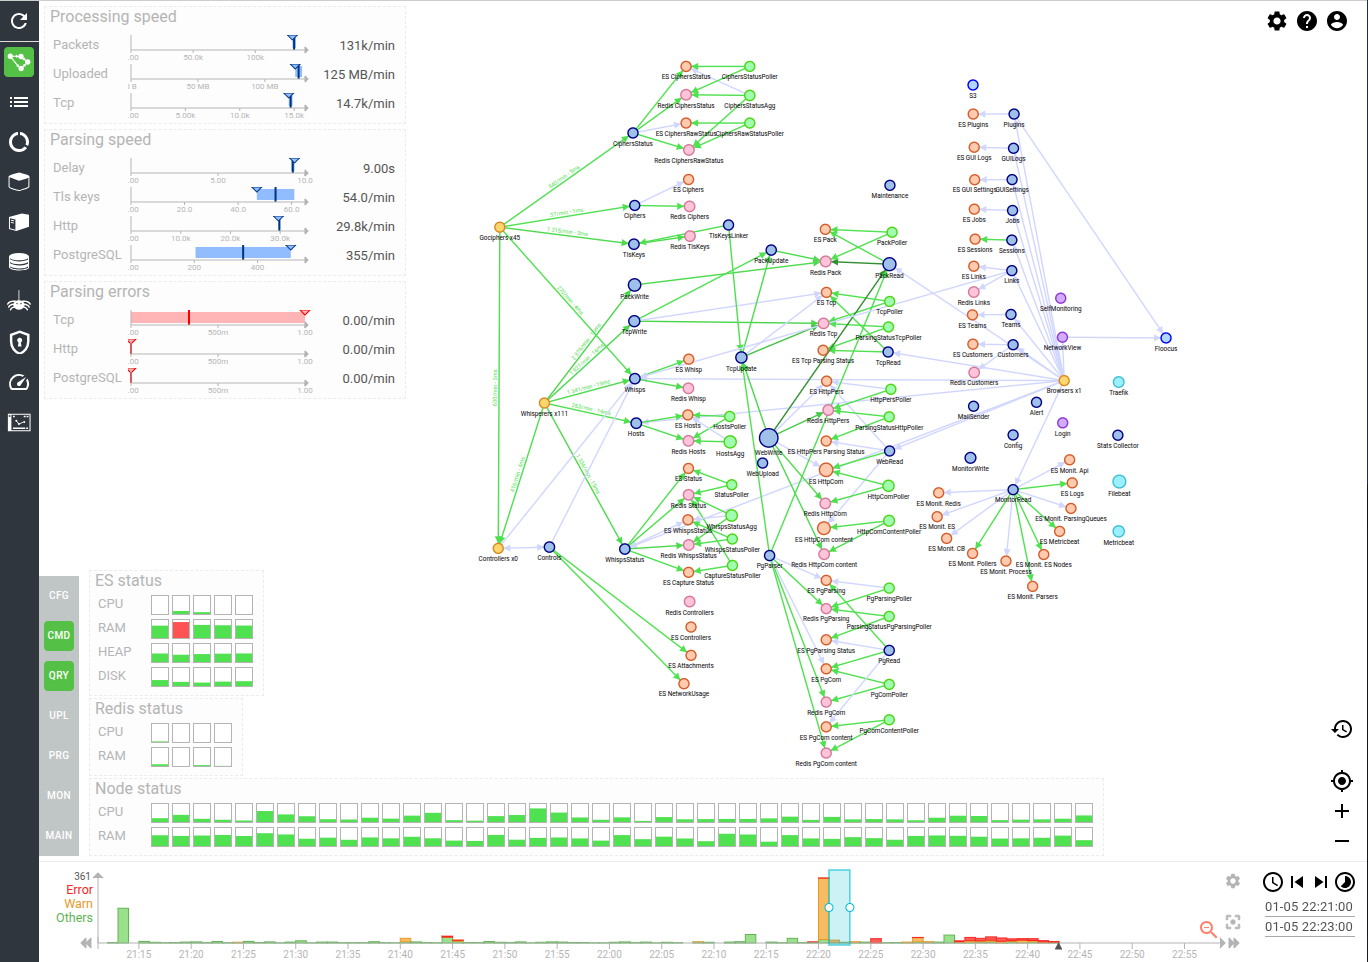
This dashboard provides a visual picture summarizing the state of the full cluster at any time.
Screenshot
Content
The content displayed is always computed based on the selected time.
The dashboard is designed so that it shows the health and speed of the system at one glance.
It is the "control tower". And is packed with information collected by all probes on Spider servers.
All other dashboards are used for troubleshooting.
Summary of applicative status (top left hand corner)
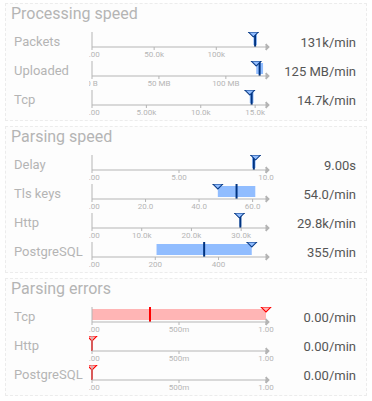
This block gives speed and load indication on ongoing parsing.
- Processing speed indicators
- Amount of packets received by min
- Data uploaded by min
- Tcp sessions received by min
- Parsing speed:
- Delay before parsing
- Count of TLS keys associated to TCP sessions by min
- Count of HTTP communications created by min
- Count of PostgreSQL communications created by min
- Parsing errors: parsing errors by min
Tooltips show min, max, average and last values.
Summary of servers status (bottom left hand corner)
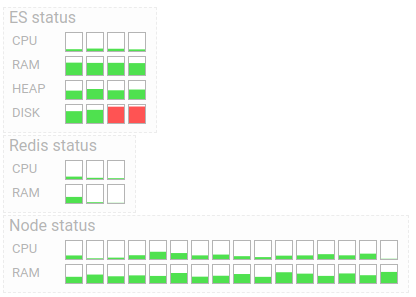
- ES status: short status of the ES servers or pods - CPU, RAM, HEAP and disk used
- Redis status: short status of the Redis servers or pods - CPU & RAM
- Nodes status: short status of the Cluster servers - CPU & RAM
Tooltips shows min, max, average and last values.
Current status of probes (top right corner)

List all probes and their status.
It calls the /health API documented here.
Network map of all Spider microservices with their inter communications
The map shows the summary of Whisperers status, UI usage status, Datastores status and Applicative cluster status:
- Number of connected Whisperers and Gociphers are shown on the left Whisperers node
- Number of connected Users is shown on the right UI node
- Circuit breakers status is represented by the arrows
- Green arrows when no errors, orange when errors
- When hovered, the arrows display the speed and average response time
- Services status is represented by the nodes
- Blue nodes when no errors, red when errors
- Size of nodes depending of the CPU usage
- Color of nodes depending of the visibility or not of the nodes
Controllers monitoring is not integrated yet. This is why they are shown as x0.
Views
The map as many different views to avoid seeing too many arrows at once:
- Config paths
- Query paths
- Command paths
- Upload paths
- Purge paths
- Monitoring paths
- Maintenance paths
Tooltips detailing the status of each Node / Link
The map element reveal tooltips when leaving the mouse over them. They may be pinned to compare different periods easily
Example of tooltips:
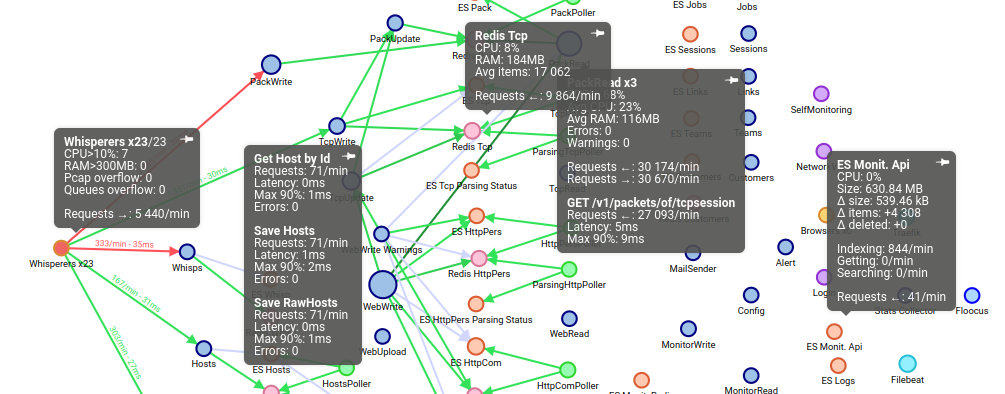
Whisperers tooltips
- Count of connected Whisperers / total
- Count of Whisperers with > 10% CPU: not normal
- Count of Whisperers with > 300 MB RAM: not normal
- Count of Whisperers with PCAP overflow: means that network is too fast for them, they need to be better configured
- Count of Whisperers with queues overflow: means that Spider servers are not scaled enough
- Total count of requests / min from Whisperers to the Spider servers
Gociphers tooltips
- Count of connected Gociphers / total
- Count of Gociphers with > 10% CPU: not normal
- Count of Gociphers with > 300 MB RAM: not normal
- Count of Gociphers with queues overflow: means that Spider servers are not scaled enough
- Total count of requests / min from Gociphers to the Spider servers
Services and UIs tooltips
- Count of replicas
- Total CPU usage on the cluster
- Average CPU usage per replica
- Average RAM usage of a replica
- Count of Errors and Warnings in the logs
- Count of requests In and Out per min
- Statistics of operational APIs
- Requests load
- Latency
- Percentile 90
Pollers tooltips
As for services +:
- Average count of items waiting to be polled
Redis tooltips
- Average CPU of the Redis instance (may be used for several DB)
- Average RAM of the Redis instance
- Average count of items in this Redis DB
- Load requests per min
ES index tooltips
- Average CPU used by this index over the period
- Size of the index
- Variation of size, count of items and count of deleted over the period
- Speed of indexing, getting and searching
- Total count of requests In
Browsers tooltips
- Number of connected Users
- Number of Users having clicked during the period ;)
- Average duration of a user session
Traefik, Filebeat & Metricbeat
- Count of replicas
- Total CPU usage on the cluster
- Average CPU usage per replica
- Average RAM usage of a replica
- Count of Errors and Warnings in the logs
Links tooltips
- List of requests made on the link with:
- Requests lod / min
- Average latency
- Max 90% latency
- Count of errors
- On hover, show summary info
