Datastores status
Description
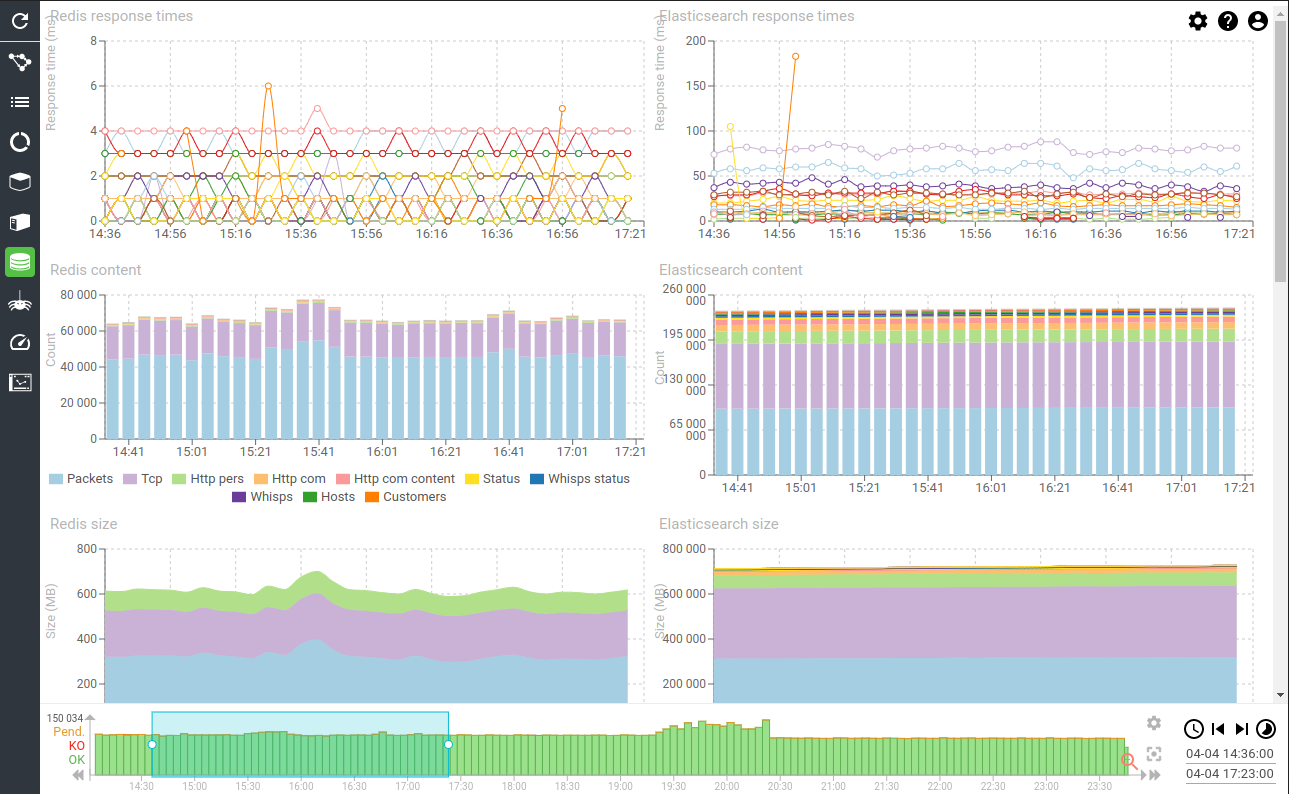
This dashboard provides a status of Elasticsearch and Redis datastores: response time, load, size, and circuit breakers.
Screenshot
Content
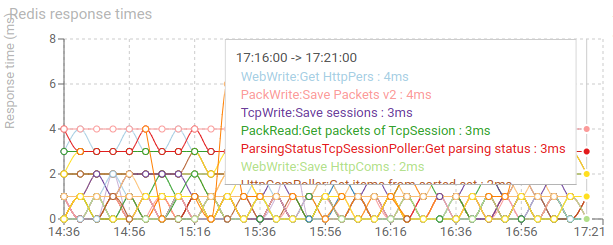
Redis response times - timed graph
Shows the response times of services and pollers calling Redis.
- ... Redis is sooo fast!
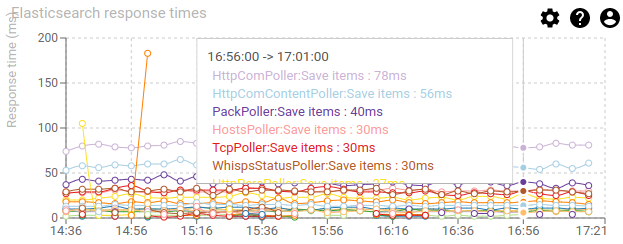
Elasticsearch response times - timed graph
Shows the response time of services and pollers calling Elasticsearch.
- Times are much longer than Redis but should stay below 300ms
- Most long times are Pollers saving data (in bulk)
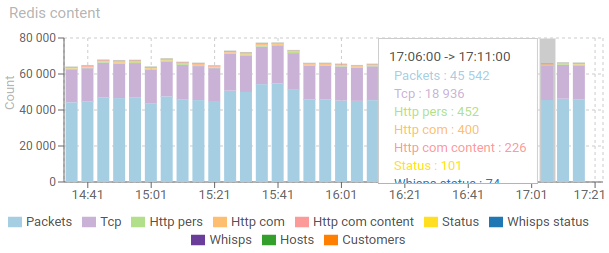
Redis content - timed graph
Show the evolution of data content in Redis memory
- The more stable, the better
- Packets count > Tcp session count > Http * count
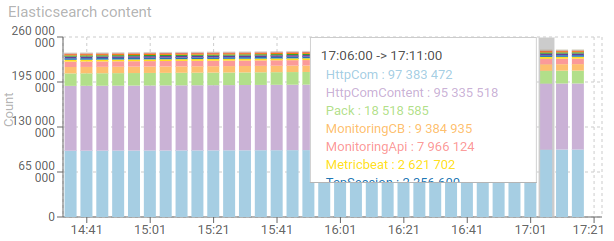
Elasticsearch content - timed graph
Shows the evolution of data stores in Elasticsearch.
- Always goes up, except when purging ;-)
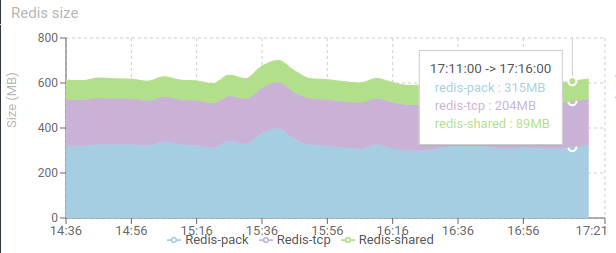
Redis size - timed graph
Shows the memory usage of Redis over time.
- The more stable, the better
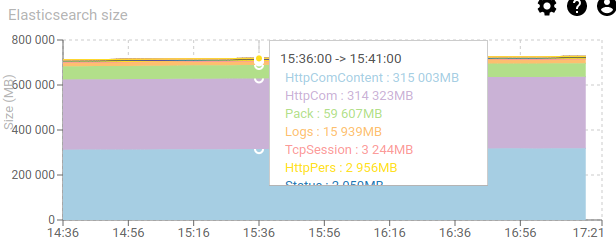
Elasticsearch size - timed graph
Shows the size of Elasticsearch indices.
Time based indices sizes are summed.
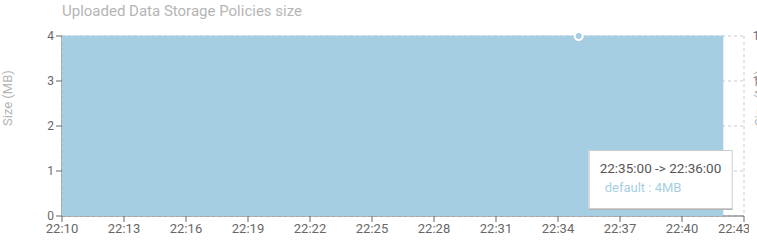
Uploaded Data Storage Policies size - timed graph
Shows the total size of uploaded DSPs over time.
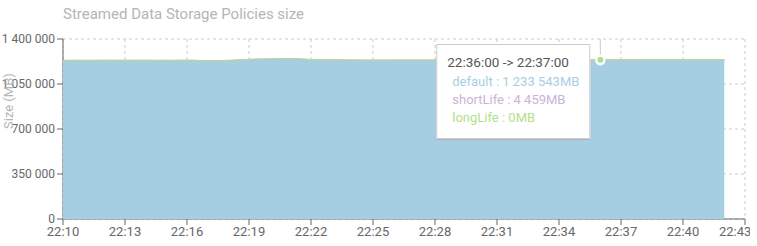
Streamed Data Storage Policies size - timed graph
Shows the total size of streamed DSPs over time.
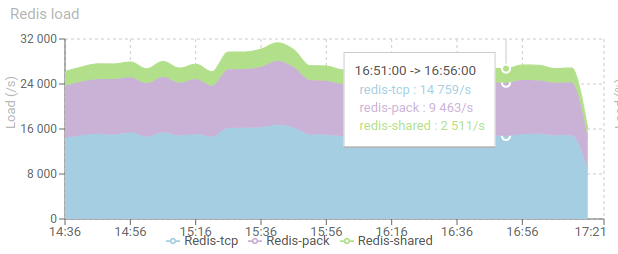
Redis load - timed graph
Shows the load of Redis in request/s.
Impressive!!
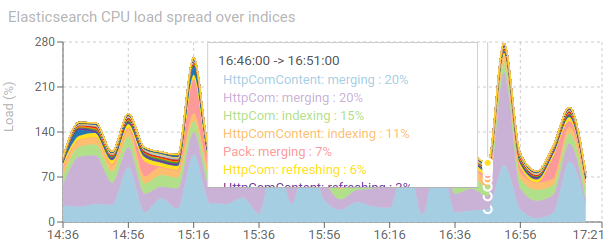
Elasticsearch CPU load spread over indices - timed graph
Shows the CPU usage of Elasticsearch spread over its indices.
- Elasticsearch activities are split for each index:
- Indexing
- Merging
- Searching
- Getting
- Refreshing
- ...
- Allows to see unexpected patterns
We may notice easily that most of Elasticsearch time is spent merging indices, because of the index load Spider is inducing.
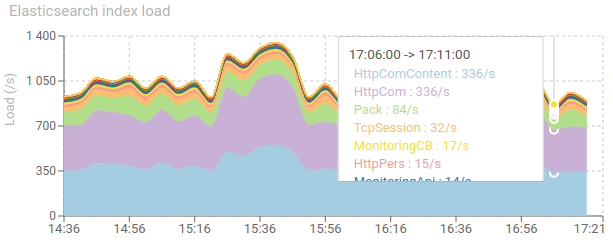
Elasticsearch index load - timed graph
Show indexing speed on each index.
- Confirms processing speed of applicative cluster
- Nb: many packets are not saved in ES to save space
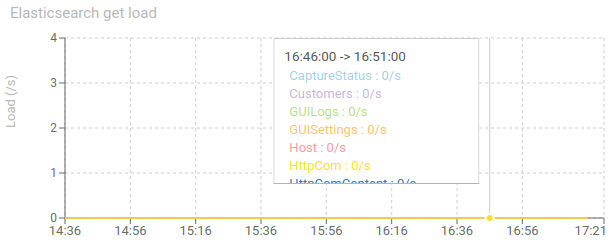
Elasticsearch get load - timed graph
Shows Elasticsearch direct document access (get)
- Almost absent in Spider thanks to cache optimisations
- This chart allowed to track those usages and effectively optimise them ;)
- It is kept for non regression!
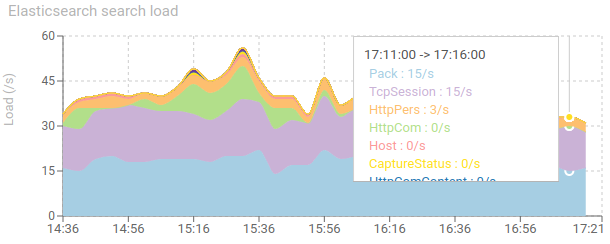
Elasticsearch search load - timed graph
Shows Elasticsearch searches
- Almost absent in Spider thanks to cache optimisations
- This chart allowed to track those usages and effectively optimise them ;)
- Searches are almost only used by UIs
When some searches are present all the time (like below), it usually means that there is somme issue in parsing, and that a/some Whisperer(s) are not sending all data.
Indeed, data is first looked in cache, then in Elasticsearch. And only when Whisperers are configured to save in Elasticsearch.
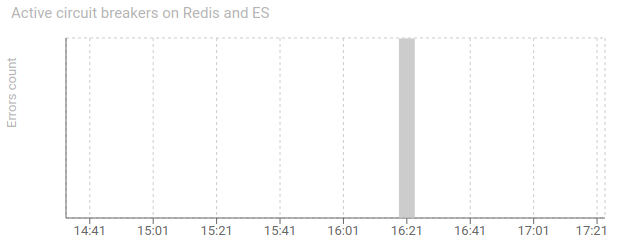
Active circuit breakers on Redis and ES - timed graph
Shows opened circuit breakers between services, pollers and Elasticsearch/Redis.
- Very often CB are opening on pollers when ES cluster is too small sized...
- But pollers retry, so this is not an issue.
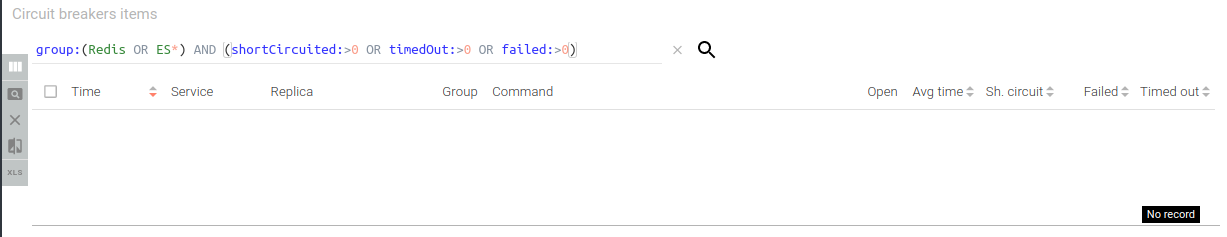
Circuit breakers items - items grid
Shows circuit breakers status over the period.
- Preconfigured to display only those between applications and datastores, and with errors