Gociphers status
Description
This dashboard provides a status of Gociphers clients: state, uploaded secrets, cpu, ram, queues, circuit breakers…
Screenshot
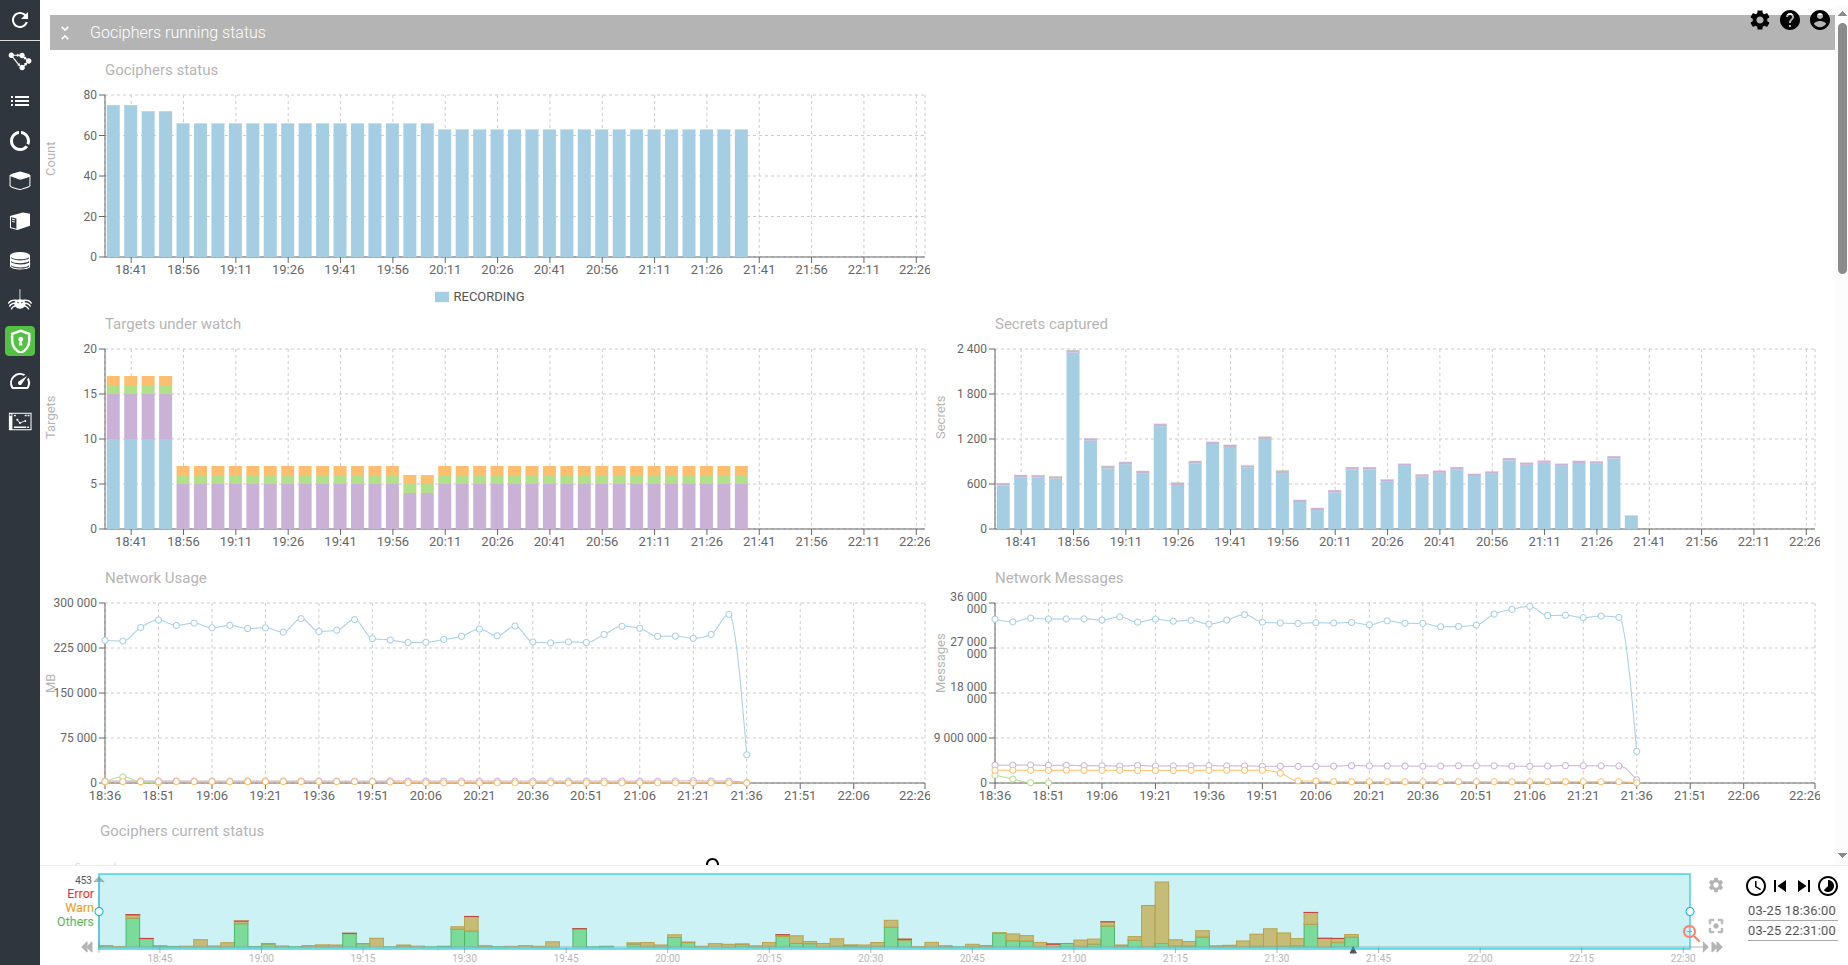
Content
Gociphers status - timed chart
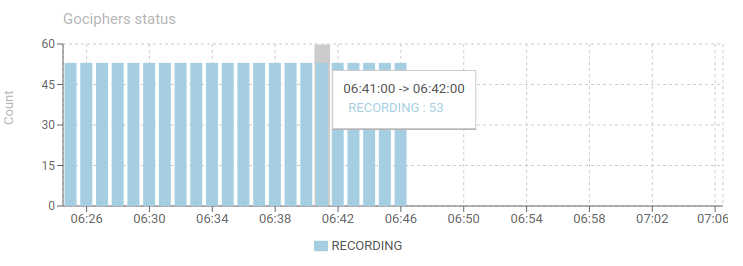
Shows the status of all Gociphers connected to the server.
- Statuses values are:
- Starting - Gocipher just got deployed
- Recording - Capture is in progress
- Stopped - Capture is paused
- Invalid_Config - Configuration needs a fix to allow Gocipher to start
- Internal_Error - You found a bug!
- Server_Down - Gocipher can't get configuration
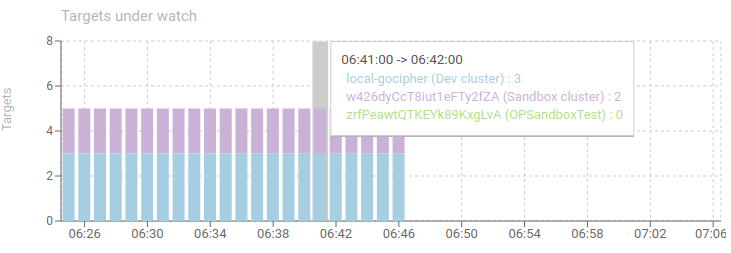
Targets under watch - timed chart
Shows the count of targets being watch, grouped by Gociphers.
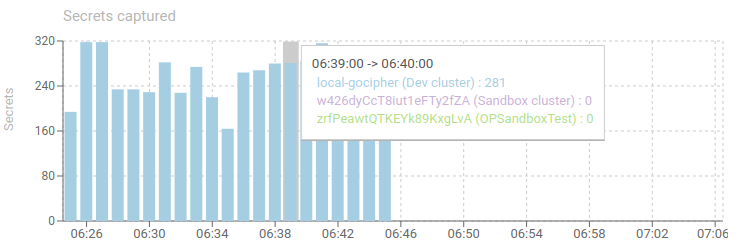
Secrets captured - timed chart
Shows secrets uploaded from the Gociphers to the server, in MB, and group by Gocipher.
Allows to quickly find Gociphers that upload most secrets... or don't.
Network Usage
Shows how many network bytes were exchanged in the Kernel by all instances of the Gocipher.

Network Messages
Shows how many network messages were exchanged in the Kernel by all instances of the Gocipher.

Gociphers current status - items grid
Shows current Gociphers status for all Gociphers and Instances.
- Gocipher and instance name
- Record is marked aggregated when the status record is the aggregated result of all instances
- Gocipher version
- Gocipher start, host monitored and uptime
- Session start and duration
- Last update
- CPU, RAM
- Secrets sent and errors
This grid allows checking that all Gociphers are up-to-date, well connected, well behaving and if errors are present.

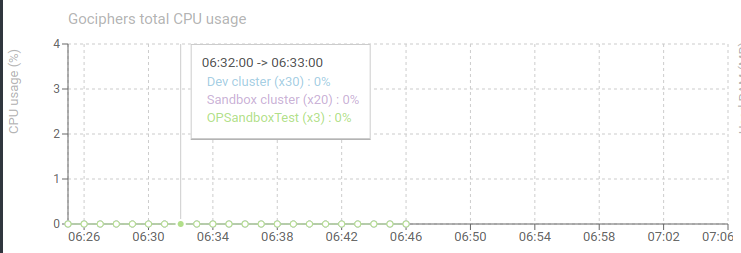
Gociphers total CPU usage - timed chart
Shows the sum of CPU usage of all replicas of the same Gocipher, over time.
You may notice how little CPU they are using!
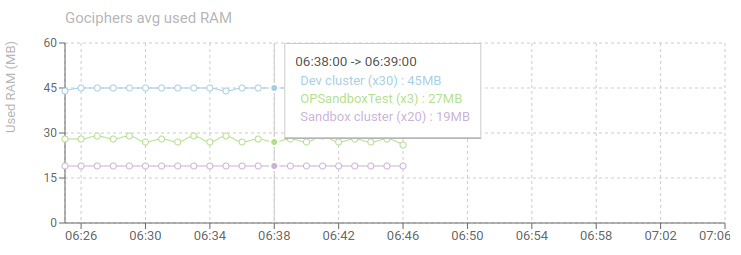
Gociphers avg used RAM - timed chart
Shows the average RAM used for each Gocipher, across all replicas.
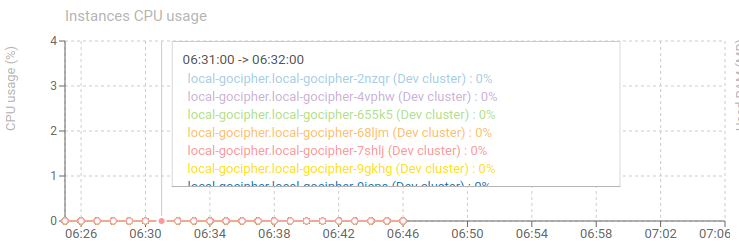
Instances CPU usage - timed chart
Shows CPU usage of all connected Gociphers instances.
- Should be low ;)
- The more packets captured and parsed, the more CPU usage.
- Captured packets can be limited by PCAP filter
- Parsed packets can be limited by Hostname blacklisting in configuration
- A circuit breaker on CPU usage can be set to pause Gociphers when too high load
- Classic usage: between 3 and 10%
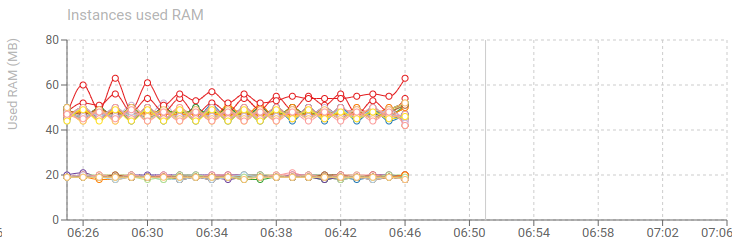
Instances used RAM - timed chart
Shows RAM usage of all connected Gociphers instances.
Classic usage:
- 120 MB when capturing and server responding
- 80 MB when stopped
Queues length - timed chart
Shows the evolution of the sending queue of Gociphers.
- 1 queue: Tls secrets
- Gocipher may send in // to Spider server (configuration).
- When a Gocipher has too many requests to send to server, it stores them in a queue, waiting for next available slot for sending.
- When items are in the queue, it means either:
- The server is getting slow and has issues
- The Gocipher is under high pressure of secrets to capture
Queues overflow - timed chart
Tracks sending queues overflow over time.
- 1 queue: Tls secrets
- When the queue is full, new items are discarded and never sent.
- This causes parsing issues due to missing secrets (most often)
This won't happen if the Gociphers and Servers are correctly scaled ;)
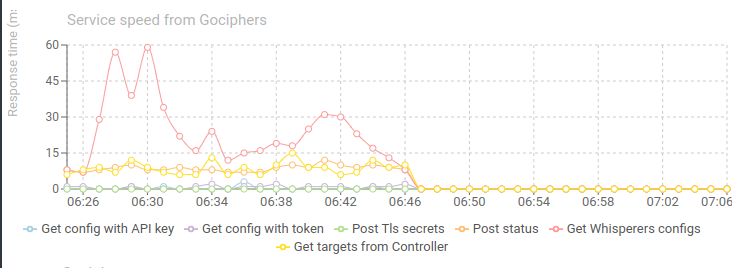
Services speed from Whisperers - timed chart
Shows the evolution of response time of Spider endpoints, as seen from the Gociphers point of view.
- 30 ms is what you would expect on local network / same Availability Zone.
- The lower, the better.
If the response time is bad add more service replicas or server nodes as needed.
Active circuit breakers - timed chart
Shows when Gociphers have active circuit breakers.
- When a Gocipher cannot connect to the server, or fails sending data (time out, mostly), a circuit breaker opens, and the Gocipher stops trying for some time.
- Data is lost
- This can happen when:
- CPU on the host the Gocipher is in is heavy loaded
- There are network issues
- Server is not scaled big enough
- Server is partially down
- When server is completely down, the Gocipher stops its capture and waits for it to get back up again