Whisperers status
Description
This dashboard provides a status of Whisperers clients: state, uploaded data, quality of parsing, cpu, ram, queues, circuit breakers…
Screenshot
Content
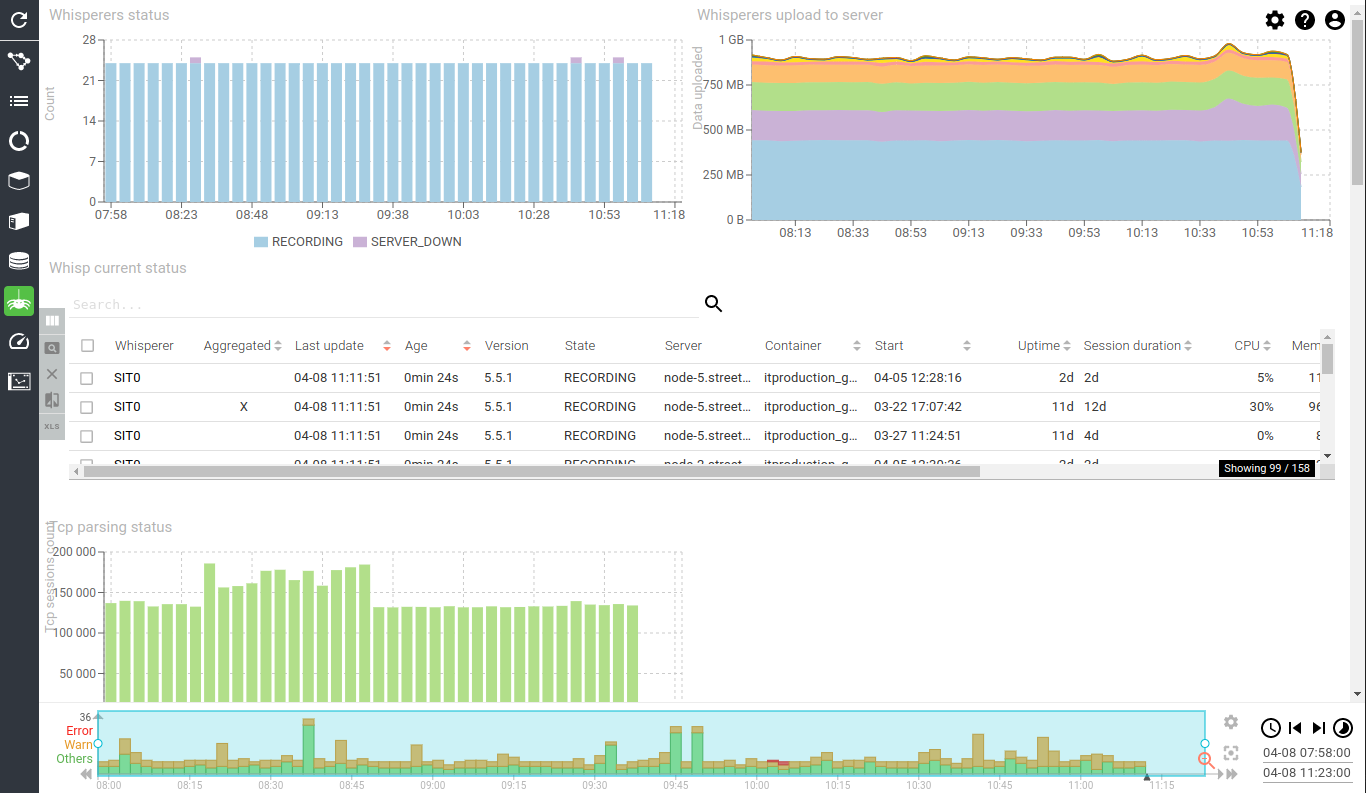
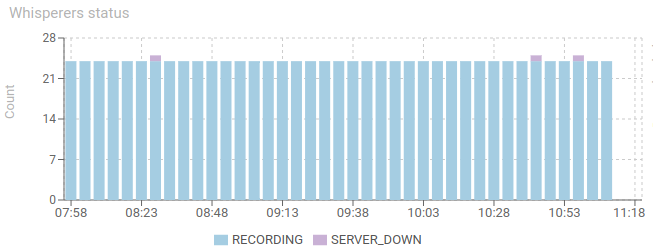
Whisperers status - timed chart
Shows the status of all Whisperers connected to the server.
- Statuses values are:
- Starting - Whisperer just got deployed
- Recording - Capture is in progress
- Stopped - Capture is paused
- Invalid_Config - Configuration needs a fix to allow Whisperer to start
- Internal_Error - You found a bug!
- Server_Down - Whisperer can't get configuration
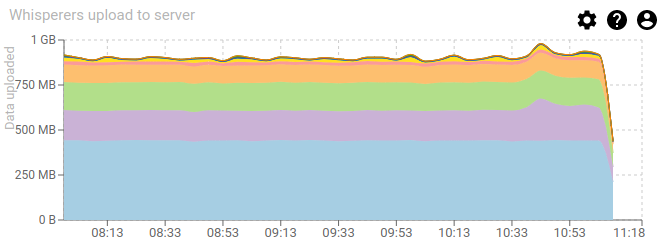
Whisperers upload to server - timed chart
Shows data uploaded from the Whisperers to the server, in MB, and split by Whisperer.
Allows to quickly find Whisperers that upload most data.
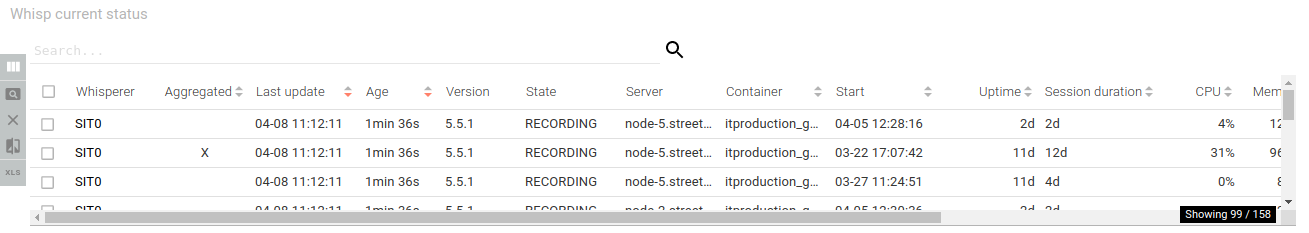
Whisp current status - items grid
Shows current Whisperers status for all Whisperers and Instances.
- Whisperer and instance name
- Record is marked aggregated when the status record is the aggregated result of all instances
- Whisperer version
- Whisperer start, host monitored and uptime
- Session start and duration
- Last update
- CPU, RAM
- Payload sent and errors
This grid allows checking that all Whisperers are up-to-date, well connected, well behaving and if errors are present.
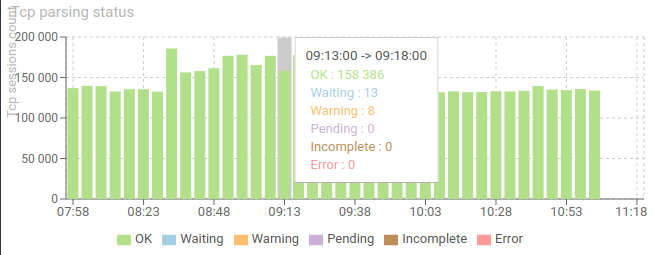
Tcp parsing status - timed chart
Shows the count of Tcp sessions, grouped by their parsing status, overt time.
Tcp session may be in:
- Waiting or Pending, when they are queued for parsing
- Incomplete when parsing is in progress, and session not closed
- Warning when parsing failed
- Error or OK, when parsing is finished
The less red, the better ! :)
Errors could have many factors, but mainly: CPU contention on clients or servers, resulting in missing packets when parsing is done.
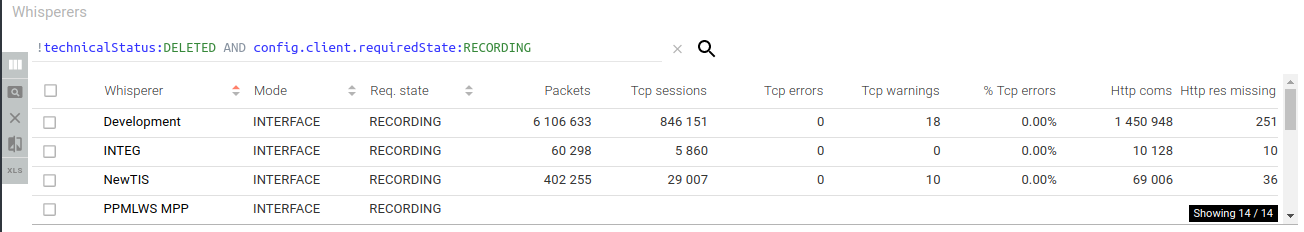
Whisperers - items grid
Lists all Whisperers in the system and give access to their raw configuration.
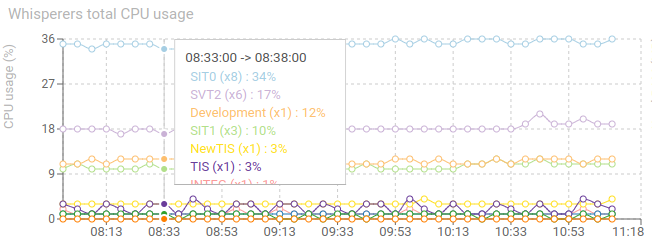
Whisperers total CPU usage - timed chart
Shows the sum of CPU usage of all replicas of the same Whisperer, over time.
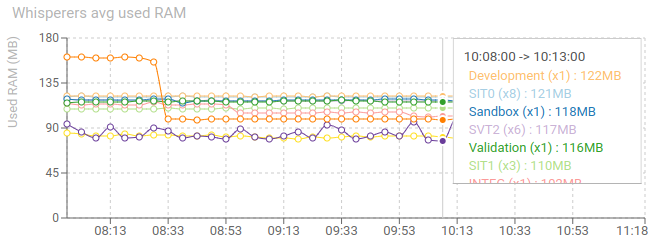
Whisperers avg used RAM - timed chart
Shows the average RAM used for each Whisperer, across all replicas.
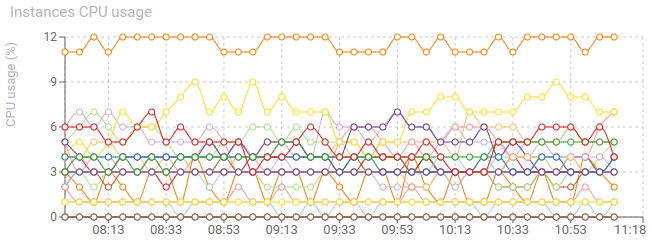
Instances CPU usage - timed chart
Shows CPU usage of all connected Whisperers instances.
- Should be low ;)
- The more packets captured and parsed, the more CPU usage.
- Captured packets can be limited by PCAP filter
- Parsed packets can be limited by Hostname blacklisting in configuration
- A circuit breaker on CPU usage can be set to pause Whisperers when too high load
- Classic usage: between 3 and 10%
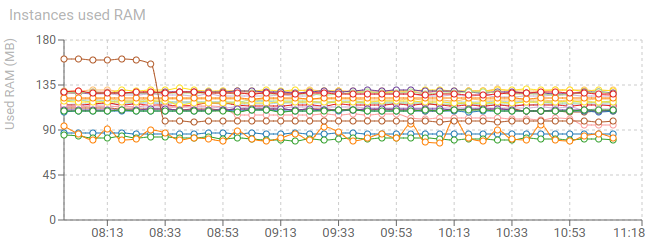
Instances used RAM - timed chart
Shows RAM usage of all connected Whisperers instances.
Classic usage:
- 120 MB when capturing and server responding
- 80 MB when stopped
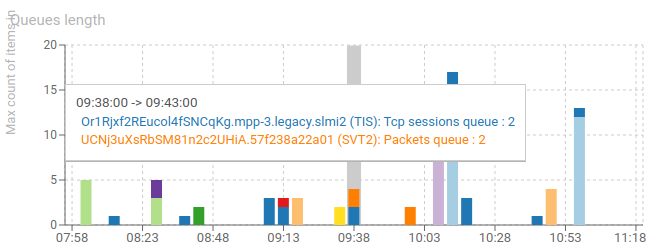
Queues length - timed chart
Shows the evolution of the sending queue of Whisperers.
- 2 queues: Packets and Tcp sessions
- Whisperer may send in // to Spider server (configuration).
- When a Whisperer has too many requests to send to server, it stores them in a queue, waiting for next available slot for sending.
- When items are in the queue, it means either:
- The server is getting slow and has issues
- The Whisperer is under high pressure of packets to capture
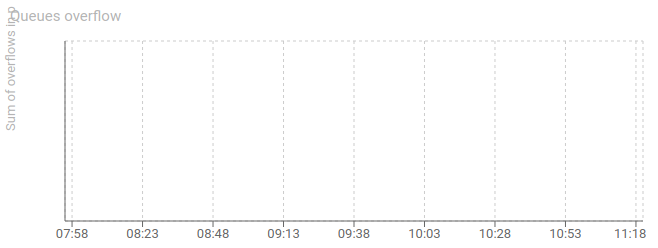
Queues overflow - timed chart
Tracks sending queues overflow over time.
- 2 queues: Packets and Tcpsessions
- When the queue is full, new items are discarded and never sent.
- This causes parsing issues due to missing packets (most often)
This won't happen if the Whisperers and Servers are correctly scaled ;)
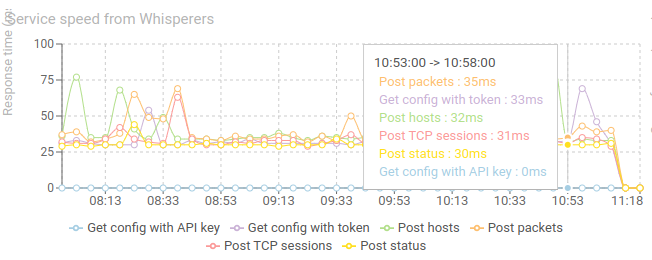
Services speed from Whisperers - timed chart
Shows the evolution of response time of Spider endpoints, as seen from the Whisperers point of view.
- 30 ms is what you would expect on local network / same Availability Zone.
- The lower, the better.
If the response time is bad add more service replicas or server nodes as needed.
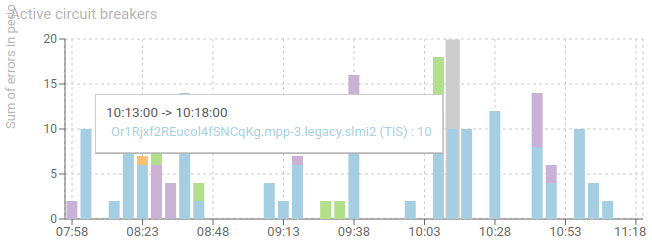
Active circuit breakers - timed chart
Shows when Whisperers have active circuit breakers.
- When a Whisperer cannot connect to the server, or fails sending data (time out, mostly), a circuit breaker opens, and the Whisperer stops trying for some time.
- Data is lost
- This can happen when:
- CPU on the host the Whisperer is in is heavy loaded
- There are network issues
- Server is not scaled big enough
- Server is partially down
- When server is completely down, the Whisperer stops its capture and waits for it to get back up again
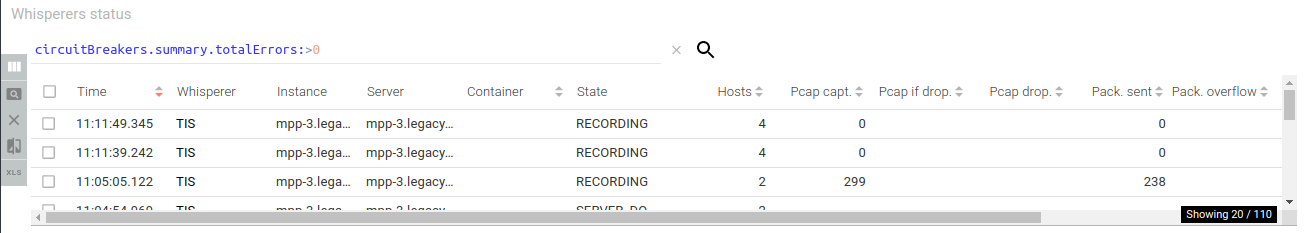
Whisperers status - items grid
Shows all status sent by Whisperers
- Items are pre filtered on those having errors
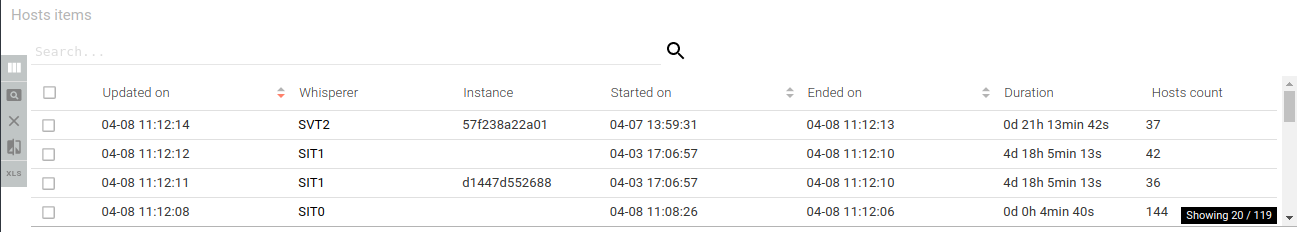
Hosts items - items grid
Lists hosts resources sent by Whisperers.
- Hosts resources tracks the name resolving of Hosts seen by Whisperers
- Start and stop of capture for each host
- Dns names
- Custom names set by users on UI or by parsing configuration
- Position on map (if fixed)
- An host resource is updated at regular interval, and a new one is created only when an host changes IP or Dns name
This grid is mostly used for debugging.
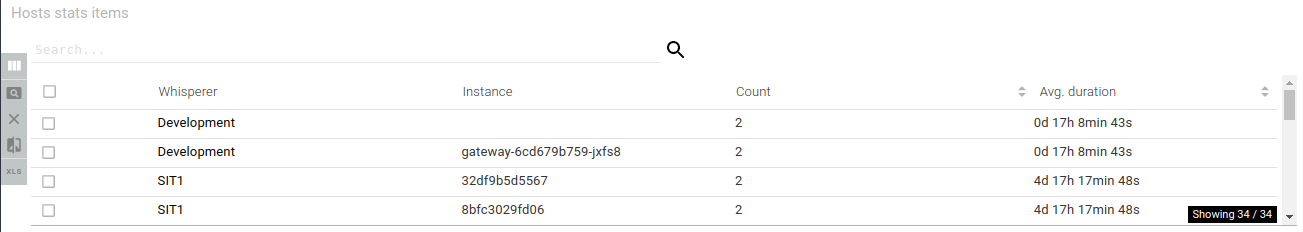
Hosts stats items - aggregated grid
Shows statistic on Hosts resources for each Whisperer over the period.
- If, over a couple of hours, a Whisperer has too many Hosts records, with a very short average duration, it means that:
- Names of hosts is not stable
- For instance Docker Swarm had a bug many years ago in reverse DNS of hosts. Often, the id of the Docker is returned instead of the name of the service replica.
- Name resolving of IPs on the UI may fail
- The UI limit its load to 99 Hosts resources at once.
- Names of hosts is not stable