Statistics collection
How are statistics collected
Usage statistics are collected and aggregated by stats-collector service every 12 hours.
They are collected by calling the related monitoring services: monitor-read, sessions...
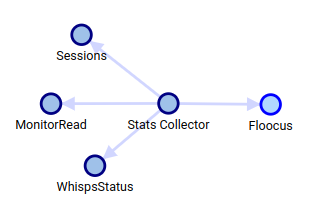
Usage statistics are then sent to Floocus central system at https://api.floocus.com for licence activity tracking.
This system is managed in High Availability and with a huge degree of Auto Scaling. It should never be a source of failures in statistics collection.
When statistics are missing
When statistics are not sent to Floocus, Spider will notice it, and:
- After 13h without statistics, Spider will raise the oldLicenseStats alert.
- After 24h without new statistics, Spider will stop the licence.
- Data collecting will stop (Whisperers)
- Data parsing in the server will stop
- The UI will display that the license is inactive

- The system will then check if statistics are pushed again regularly, and will reactivate the parsing as soon as the situation is fixed.
Statistics collected
Description
The table below lists all metrics collected and sent to central.
Metrics do not contain any personal information.
| Metric | Description |
|---|---|
| startTime stopTime range | Period of collection (daily) |
| whisperers | How many whisperers have collected in the period |
| users | How many users have been using the UI in the period |
| usersOnMonth | How many users have been using the UI this month |
| cpu.count | Total CPU of the cluster |
| cpu.usage | Distribution of CPU cores usage |
| logs | Count of logs above INFO level, grouped by level and code |
| sessions | How many active UI sessions per hour |
| actions | How many UI users actions per jour |
| uploaded.bytes | Total data uploaded in volume |
| uploaded.packets | Count of uploaded packets |
| uploaded.tcpSessions | Count of uploaded TCP sessions |
| parsing.sessionsParsed | How many TCP sessions have been parsed |
| parsing.comsCreated | How many HTTP communications have been created |
| stored | Volume stored in Elasticsearch for each index kind |
Sample
{
  "@type": "Stats",
  "endpoint": "https://spider.hub.flowbird.cloud",
  "license": "CiaIZh_eQdKUy5hcwITl5w",
  "startTime": "2023-04-12T00:00:00.000Z",
  "stopTime": "2023-04-12T23:59:59.999Z",
  "range": {
    "firstTime": "2023-04-12T00:00:00.210Z",
    "lastTime": "2023-04-12T23:59:59.916Z"
  },
  "whisperers": 53,
  "users": 13,
  "usersOnMonth": 33,
  "cpu": {
    "count": {
      "144": 86400
    },
    "usage": {
      "3": 320,
      "4": 6280,
      "5": 500,
      "6": 180,
      "7": 80,
      "6.8": 40,
      "8.7": 40,
      "6.9": 40,
      "3.1": 820,
      "3.2": 2140
      //...
    }
  },
  "logs": {
    "40": {
      "count": 250,
      "codes": {
        "WEBW-PARS-025": 179,
        "ALRT-PARS-003": 15,
        "WEBW-PARS-024": 3,
        "XXX-REDIS-004": 61
        //...
      }
    },
    "50": {
      "count": 22,
      "codes": {
        "TCPU-API-005": 3,
        "XXX-INIT-003": 15,
        "WEBR-API-003": 2,
        "WEBR-API-002": 2
      }
    }
  },
  "sessions": {
    "0": 0,    "1": 0,    "2": 0,    "3": 0,    "4": 0,    "5": 0,
    "6": 2,    "7": 0,    "8": 1,    "9": 5,    "10": 2,    "11": 1,
    "12": 4,    "13": 4,    "14": 6,    "15": 2,    "16": 1,    "17": 2,
    "18": 1,    "19": 2,    "20": 1,    "21": 1,    "22": 0,    "23": 0
  },
  "actions": {
    "0": 0,    "1": 0,    "2": 0,    "3": 0,    "4": 0,    "5": 0,
    "6": 0,    "7": 0,    "8": 218,    "9": 0,    "10": 0,    "11": 55,
    "12": 20,    "13": 16,    "14": 64,    "15": 254,    "16": 73,    "17": 115,
    "18": 5,    "19": 64,    "20": 40,    "21": 0,    "22": 3,    "23": 0
  },
  "uploaded": {
    "bytes": 279262148254,
    "tcpSessions": 40524528,
    "packets": 302419245
  },
  "parsing": {
    "sessionsParsed": 43125985,
    "comsCreated": 16440024
  },
  "stored": {
    "operations": 749699641995,
    "monitoring": 23606843306,
    "config": 59497411,
    "utils": 8816811
  }
}