Control retention volume
Depending on your system, and whether you're capturing a production system or one of your testing environment, Spider may collect a lot of data, and it can be challenging to keep it all.
This section will help you to:
- Design and allocate your space to store data
- Define your storage policy to limit retention time (and thus volume)
- Limit the capture to lower your retention needs
- Filter the parsed data to reduce the volume to keep
Storage volume
Spider is serializing all its data in Elasticsearch.
Elasticsearch (ES) is used as a NoSQL CRUD store for configuration as well as a time series database for communications.
Even if Spider do not use Elasticsearch when parsing - all is done in streaming via Redis - ES search engine and analytics capabilities are essential for Spider analysis tools.
Storage allocation
Storage allocation is done either:
- When creating the Elasticsearch cluster
- When asking for the Persistent Volume Claim by setting
kubernetes.elasticsearch.volume.sizevalue insetup.yml
kubernetes:
  elasticsearch:
    nodes: 1             # count of requested nodes in the cluster
    volume:
      size: 1Gi          # size (Gi) of volume to create for each node
      storageClassName:  gp2 # storageClass to use
To define what volume to provision, you need to understand what is stored, and how to compute it.
Volume by index
Elasticsearch stores data in indices.
Spider groups its data in 4 different kind of indices, from the biggest to smallest:
| Index kind | Description | Samples | Size |
|---|---|---|---|
| operations | Time based indices storing communications data | Http communications, Tcp sessions, Packets, Hosts... | 100 GB+ |
| monitoring | Time based indices storing high cardinality data track system behavior | Process, Status, CircuitBreakers... | 10 GB+ |
| utils | Time based indices storing small cardinality data for UI needs | Jobs, Links, Sessions... | 50 MB |
| config | Simple indices storing configuration (CRUD) | Users, Teams, Whisperers... | 10 MB |
- With Swarm setup, ES is outside the cluster, and you may defined different cluster to store different data.
- In Kubernetes setup, ES is installed in the Kube, and - by default - only one cluster is used by Spider.
The Size above give you an estimation of volume difference for the indices.
However, you have to determine the appropriate storage volume depending on your load.
For each Whisperer you will decide what to store:
- Packets
- Tcp sessions
- Http Parsing logs
- Http communications metadata
- Http communications content
In terms of volume size, Packets > Http communications > Http parsing logs > Tcp sessions.
But then it all depends on what you wish to capture.
Best it to start with an empiric provisioning, and be ready to increase its size after some hours / days.
Index replicas
In the setup.yaml, you're defining the count of replicas for each index kind:
    operations:
      replicas: 1
    config:
      replicas: 2
    utils:
      replicas: 1
    monitoring:
      replicas: 1
Replicas can be between 0 and... many.
A replicas is a copy if the index, managed by Elasticsearch, which will be used for High availability, and to scale searches.
- Setting them to 0 will take the smallest volume (no replica)
- 1 replica means that it takes twice the volume of data
- 2 replica... thrice
- etc.
Take this into account when evaluating storage to provision.
For high availability, it is important to replicate configuration data.
As they are the smallest, you may put many copies.
Index shards
    operations:
      shards: 3
    config:
      shards: 1
    utils:
      shards: 1
    monitoring:
      shards: 3
Spider uses sharding to split high volume indices into smaller ones.
You may increase the shards count up to the number of Elasticsearch nodes you've set.
- For
operationsindices, sharding is routed on the Whisperer@idkey.- If you have only a few Whisperers, your cluster will be unbalanced, and sharding would be inappropriate.
- For other indices, sharding is left to Elasticsearch default.
Shards do not impact much on the volume size, but it impacts the balance of the cluster:
- If you've put 3 shards for 3 nodes hoping to balance the data in all nodes,
- In fact the data may all end up in to the same node... if you've only a few whisperers.
Sharding becomes useful only when you have many whisperers, to balance the indexing load on the various nodes.
Storage retention policy
Spider index lifecycle management policies (ILM)
In order to allow indices optimization with time, as well as fast purge of data, most Spider indices are time based.
It means that:
- They are composed of many indices regrouped in an alias
- The latest index is used to write new data, and is optimized for indexing
- All older indices are in read only, and optimized for searching
- A rollover operation is performed to turn the new index into an older one
- After a customisable time to live, old indices are removed, thus freeing space
You configure the ILMs in setup.yml file.
    operations:
      rollover: 6h
      ttl: 6d
      ttlshort: 1d
      ttlupload: 30d
    monitoring:
      rollover: 1d
      ttl: 6d
    utils:
      rollover: 5d
      ttl: 6d
Roll over delay
The rollover delay is the duration after which the new writable index is rolled over into an old read only one.
- For
operations, it must be rather small,1dmaximum, depending on your load.- Remember that they will get removed 1 index at a time
- For
monitoring,1dis ok to have reasonably sized indices - For
utils, the load is small,5dis ok
The most important to tune is the rollover setting for operations.
Time to live - TTL
The ttl settings define when the indices are removed after their rollover.
The smallest the values, the least storage space they will take.
Operations indices have 3 different ttls:
- ttlshort - Used for Packets only. It allows defining a specific - short term - TTL for packets, independently of others,
- ttl - Used for Tcp sessions, Http parsing log, Http communications, Hosts,
- ttlupload - Used as a replacement for data that has been UPLOADED on the UI, not streamed by Whisperers. Usually much longer.
Limit capture
In Spider, there are many ways to limit what packets are captured by the Whisperers.
Pcap filters
First, you may define a packet capture (pcap) filter in Capture Config tab of your whisperers.
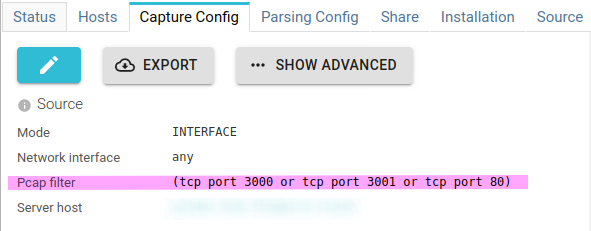
This filter filters the packets that are sent from the pcap library to the Whisperer.
Setting it properly to limit the protocols and ports to capture will :
- Lower the amount of packets processed by the Whisperer (lower CPU)
- Reduce the network bandwidth used between the Whisperer and the server
- Lower Redis memory usage
- Decrease the CPU usage of the server
- Reduce the packets storage in Elasticsearch
Reference for pcap filters: https://www.tcpdump.org/manpages/pcap-filter.7.html
Whisperers automatically filter out communications made to Spider server.
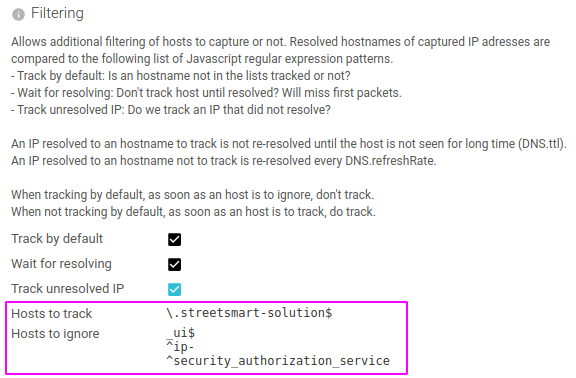
Hosts filters
Also in Capture Config tab of your whisperers, you add extra filter not possible in pcap:
You may limit the capture to certain hostnames by playing with a blacklist and a whitelist.
- Both list accept regular expressions.
- The packets received by IP addresses which resolved name match are filtered out (or kept).
Limit to data packets
Yet again in Capture Config tab of your whisperers, there is an option to capture (and send) ony data packets.
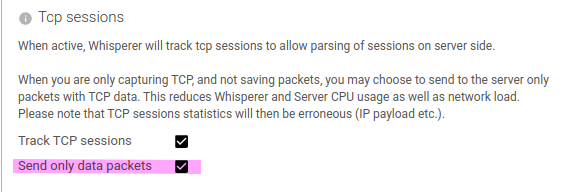
This effectively adds a complex pcap filter to limit the IP packets captured:
((tcp[tcpflags] & (tcp-syn|tcp-fin|tcp-rst) != 0) or (((ip[2:2] - ((ip[0]&0xf)<<2)) - ((tcp[12]&0xf0)>>2)) != 0))
Indeed, by default, Spider captures all packets, but only a subset are required for Spider flow reconstruction.
This option lowers the packets count by up to 30%, as well as pack-write CPU usage.
Avoid duplicates
Last option to spare volume on Capture Config tab: avoid duplicated packets.
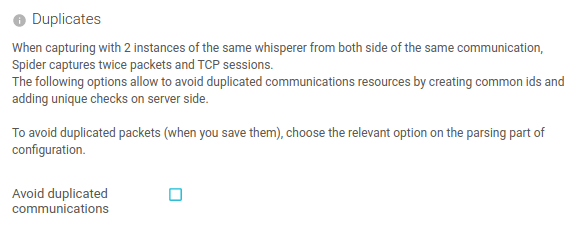
This option changes the way Spider identifies packets so that the same packet captured on both side of a communication is stored only once.
This option introduces much CPU overhead on Elasticsearch. It must be used only when necessary.
Discard parsed data
On server side, in Parsing Config tab, there are also many options not to store data when you don't need them.
Not storing packets, TCP sessions and parsing log
First, if you're not interested in low level troubleshooting, but if you only want to see higher level protocol communications in Spider, you may get rid of packets and TCP sessions once the parsing is done.
Indeed, Spider parses in real time, in streaming, and do not need to serialize packets and TCP sessions to work properly.
Similarly, saving parsing log is only interesting when you're debugging Spider ;-)
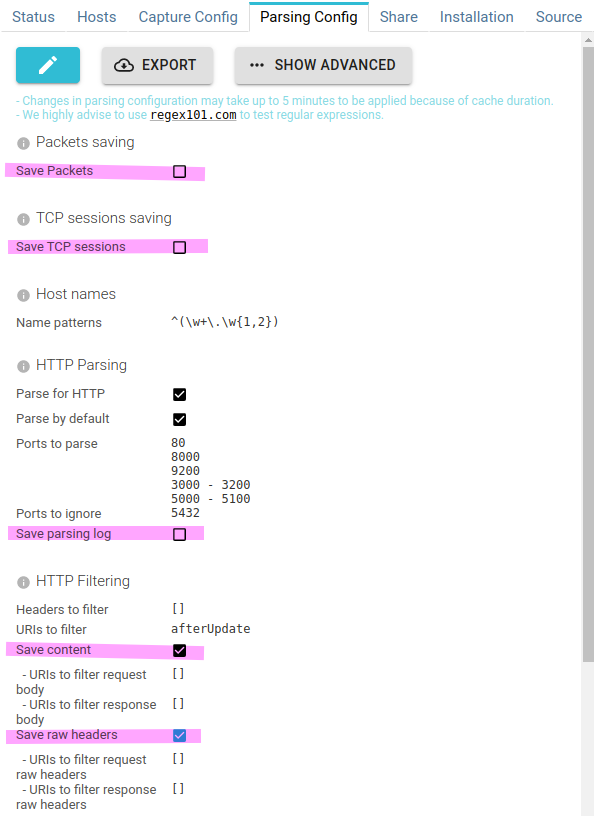
Here are the options:
- Save Packets - Uncheck when you don't need to access data at packet level
- Save TCP sessions - Uncheck when you don't need TCP sessions statistics
- Save parsing log - Uncheck... uncheck.
- Save content
- Check if you've unchecked
Save Packetsand you still want to see request and response bodies. - Uncheck if you are only interested in communications meta data
- Check if you've unchecked
- Save raw headers
- Check if you've unchecked
Save Packetsand you still want to see the raw headers, as transmitted, in HTTPHeaderstab.
- Check if you've unchecked
Filter content
You may also filter out:
- HTTP request or response headers
- Some complete communications, by a list of URIs
- Request or response bodies, by a list of URIs
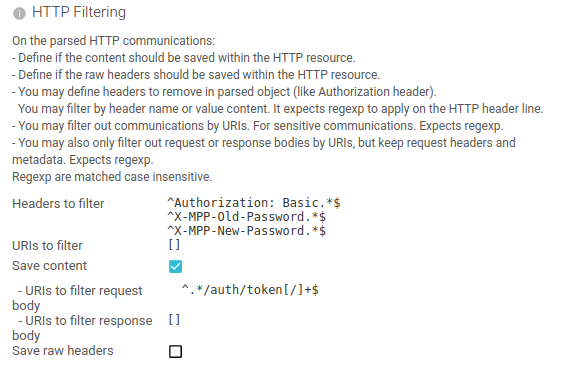
Those options are mainly meant to filter sensitive information.
But they have proven useful to filter big payload that would be useless for analysis:
- Static UI assets
- Help pages
- ...
Conclusion
You have seen in this page current tuning options you have to control the storage requirements of Spider, from the storage options to the discarding of parsed data after analysis.