Launch capture on a workload
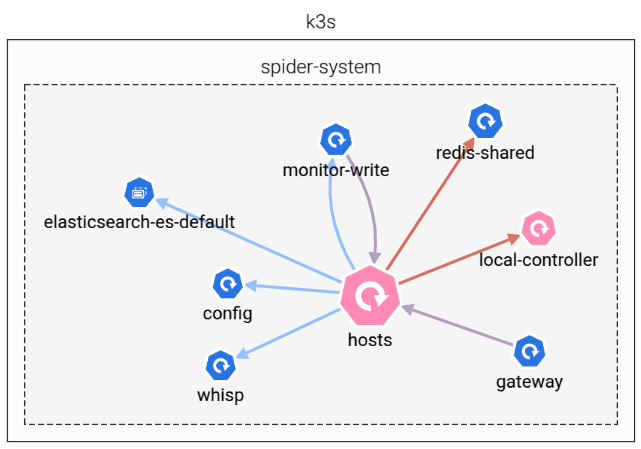
After selecting Controller, Logical view, Map and Grid, you can see the Kubernetes cluster appear:
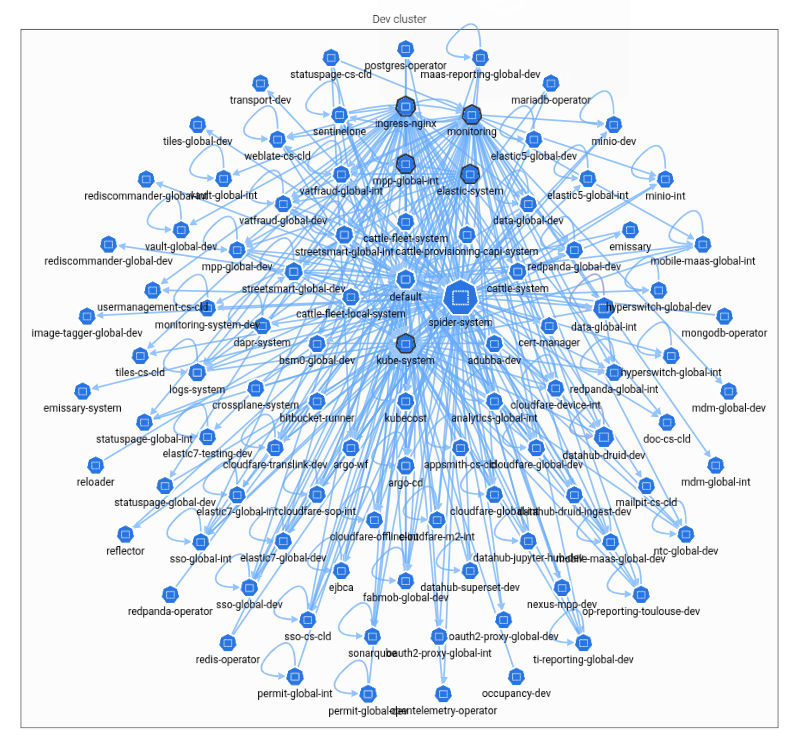
It shows Kubernetes workloads communicating together. Workloads are regrouped by their namespaces.
If you do not see any data, use the timeline to select a period with data.
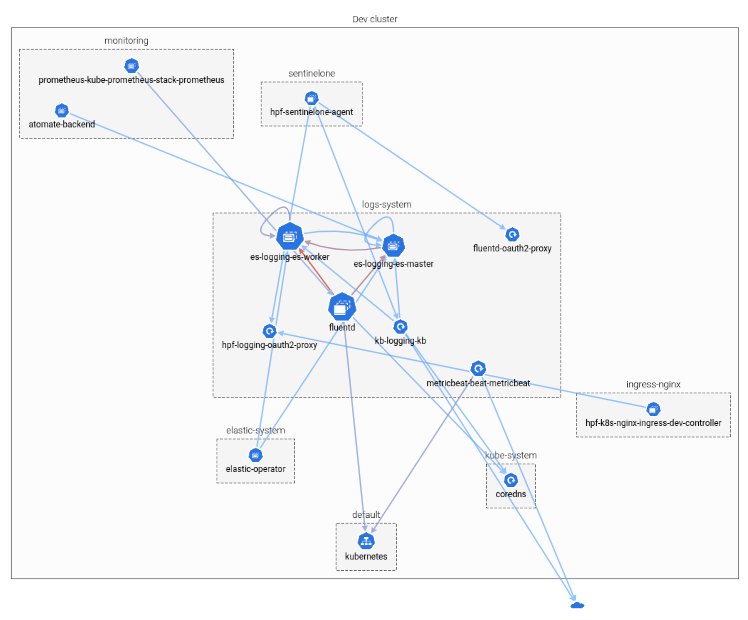
👉 Click on a namespace to select it and display its workloads and the namespaces and workloads it is communicating with.
- Workloads with attached Whisperers are shown in pink.
- When there are more than 10 workloads in the same namespaces, and aggregate icon is shown.
Open the workload
👉 Select a workload with no running Whisperer and click on it to open the Workload details.
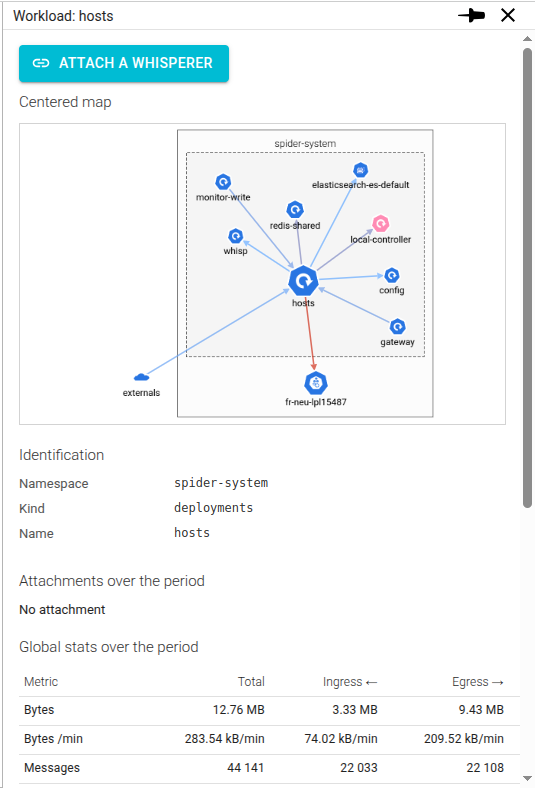
It shows a small map centered on the selected workload with usage statistics.
It also offers the possibility to attach a Whisperer.
👉 Click Attach a Whisperer.
You must have Attach right on the Controller.
Attach a Whisperer
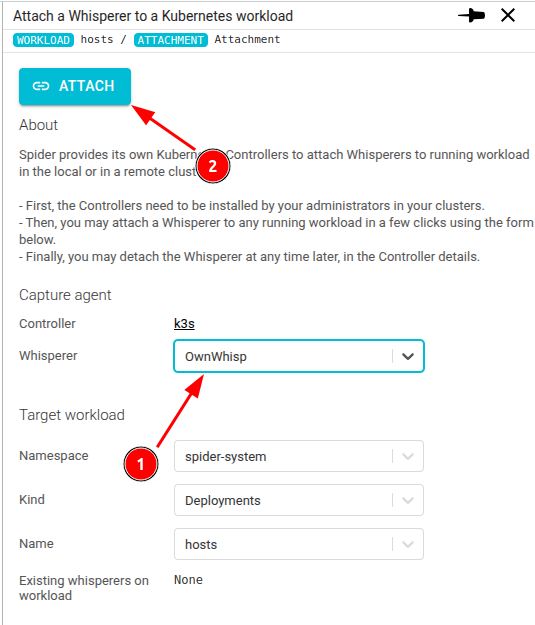
👉 Select a Whisperer to capture the network.
You must have access to Whisperers from your team.
👉 Click on the Attachment link at the bottom to check the attachment status.
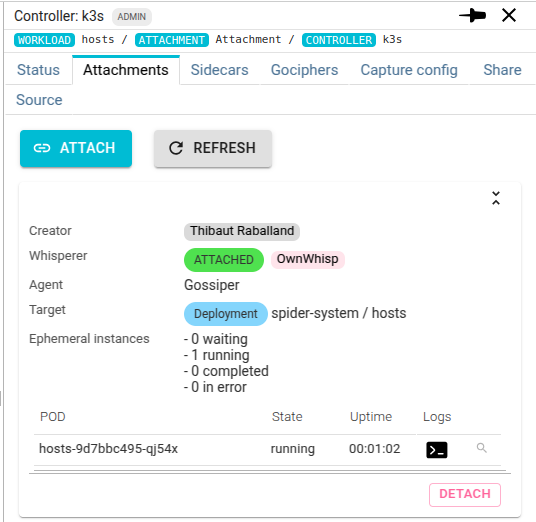
The workload gets pink on the map on refresh:
Let's now access the Whisperer capture data