Stats
Concept
The stats panel offers the possibility to perform statistics over a selection of calls.
Statistics depend on:
- Selected whisperer(s)
- Filters
- Time selection
Spider has two mode to compute statistics:
Global- over the whole time range, such as:- The response time stats.
Moving window- by sub time periods, such as:- The evolution of the maximum response time every minute
- The statistics of data exchanged per minute
Then the stats may be computed over the whole set of filtered data or grouped by various dimensions (pivots).
The available metrics and groups depend on the selected protocol.
Composition
The Stats panel is allowing to add different stats one after another.
- The
Stats barat the top- Allows to
ADD STAT - Allows to navigate from one to another and keep track of all configured stats.
- Allows to
- Each stat includes a toolbar at the top to manage it
Managing stats
Add
Click on the ADD STAT button to add a new stat.
By default it is not configured and does not display anything.
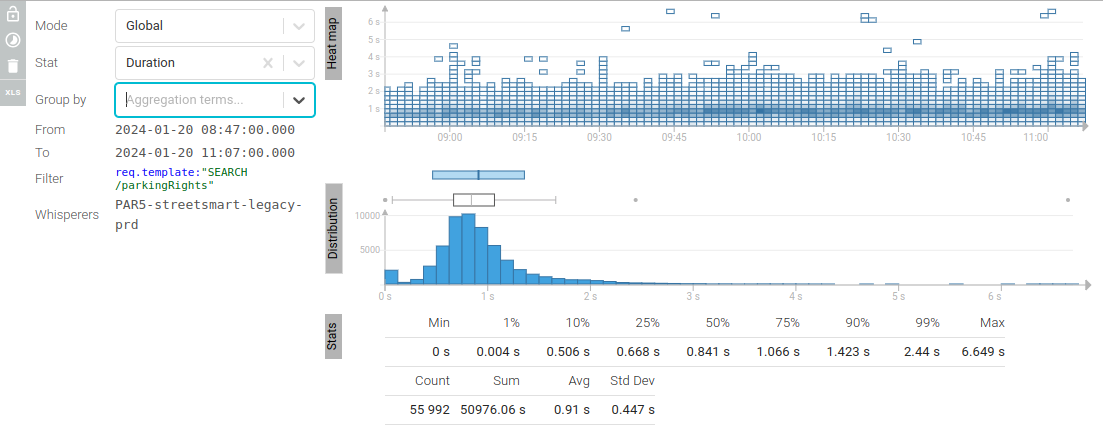
Edit
The left part of stats features a form to edit the stat.
| Paramater | Mode | Description |
|---|---|---|
| Mode | - | The mode: Global or Moving window |
| Stat | Moving W | The function to compute over the metrics during each window. |
| Stat | Global | The metrics the stat may be computed on. Like Duration, Size... Depends on the protocol. |
| Each | Moving W | The window over which to perform stats: second, minute, hour... |
| Group by | Both | Protocol fields available to perform pivot on. |
It also shows:
- The selected time range
- The active filter
- The selected whisperers
Any change you perform on these in the other parts of the UI are reflected here.
Lock
You can lock the configuration of a stat with the 2 lock buttions on the left toolbar.
 Lock settings
- All parameters, whisperer and filters are locked
- Use it to compare stats for various environments, different dataset...
 Lock time
- Time selection is locked
- Use it to compare stats on different time periods
Locking both allows to keep stats for the selection, and go digging in parallel.
Delete
To delete a stat, click either:
- On the
Deleteicon of the toolbar - On the
Xicon of the stat in the Stats bar
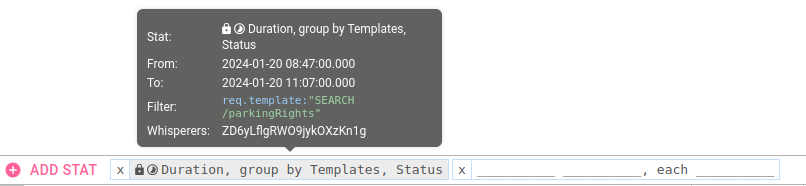
Stats bar
You may have several stats computed at once, to study a dataset from various angles.
The stats bar allows you to:
- Add a stat
- Navigate between stats like a taskbar
- Show stats parameters in tooltip
- Show if a stat is locked
Stats label is based on selected parameters and a tooltip provides all details.
To know:
- Current visible stats are highlighted in blue.
- You may open up to 10 stats.
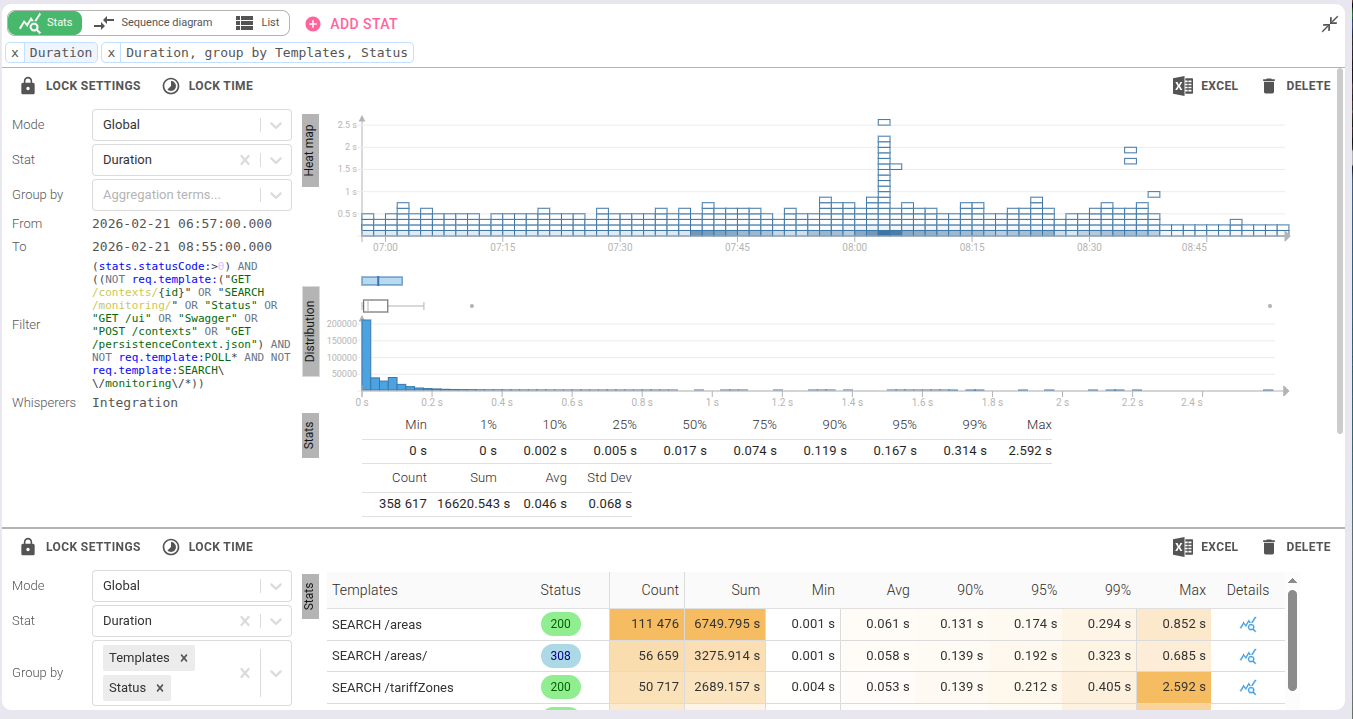
Global stats
Global stats compute statistics over the whole time range.
Composition
Global stats are composed of 3 parts:
- Heatmap
- Distribution
- Raw stats
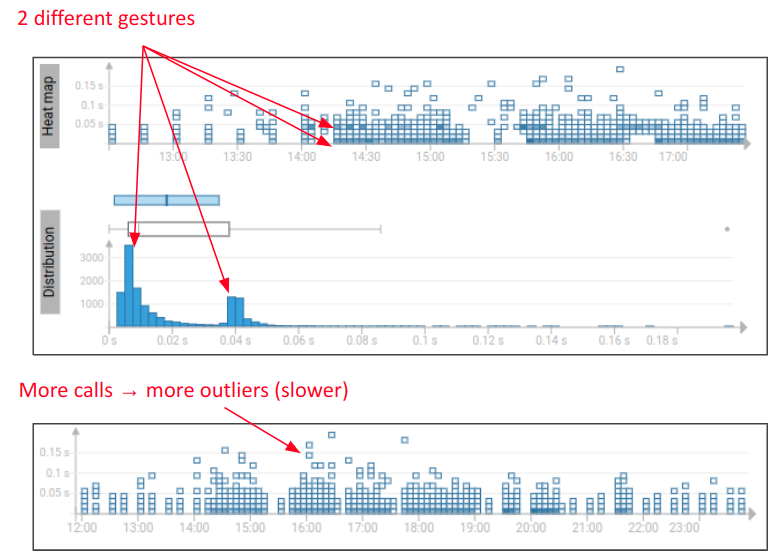
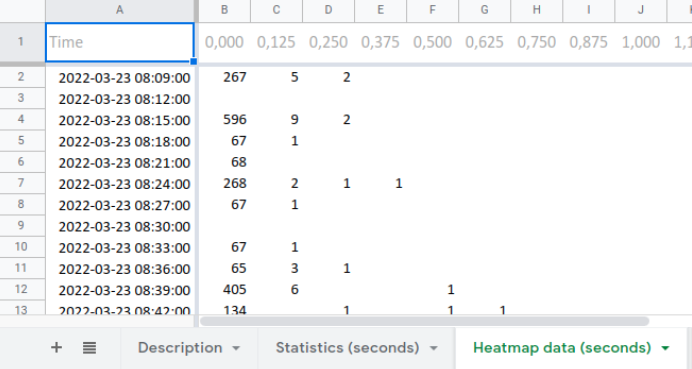
Heatmap graph
The Heatmap graphic shows the distribution of the metric value over time.
- Horizontal axis: time
- Vertical axis: the metric value
- Color: the count of items with this value for that time
It allows, in a glance:
- To see if and when outliers occur
- To see if massive amount of calls have generated higher metric value
You may access the related data by clicking on the heatmap cells.
It will set the time and filters required to zoom on these data.
The heatmap is very useful to identify patterns in the calls.
The heatmap is available on different axes on the dashboard widgets.
Distribution graph
The Distribution graphic shows the global distribution of the metric value
- Horizontal axis: the metric value
- Vertical axis: the count of items with this value for that time
In a glance, this graph allows to:
- Find the usual distribution
- Find and access outliers
- Identify several patterns in the data from the count of juxtaposed ‘normal law’
Hover on the graphic parts to get statistics values.
You may filter to see the relevant data by clicking on the histogram bars
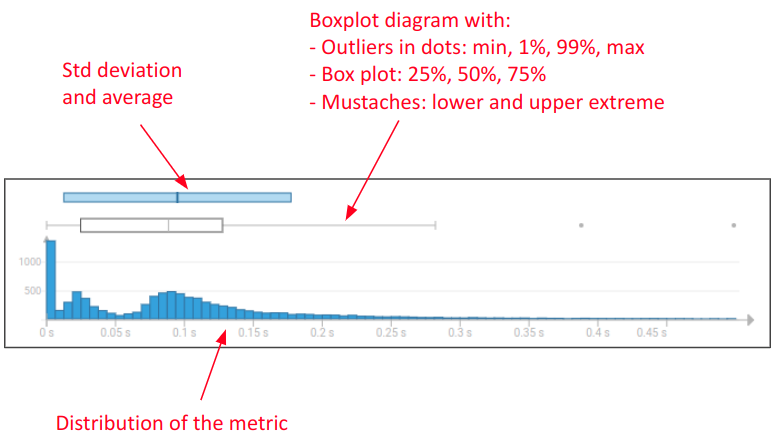
Raw stats
The Stats section gives you the computed value for classic metrics:
- Minimum
- Percentiles
- Count
- Sum
- Average
- Standard deviation
Moving window stats
Moving windows stats compute statistics by sub time periods over the time selection.
Composition
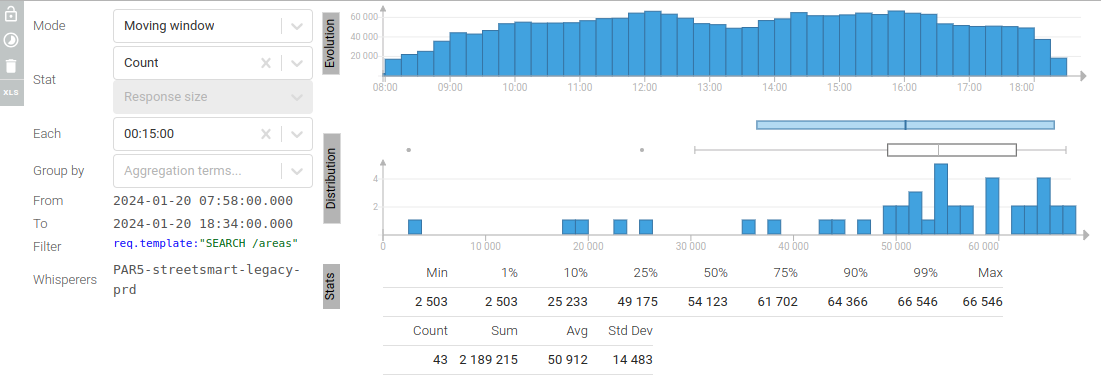
Moving window stats are composed of 3 parts:
- Evolution
- Distribution
- Raw stats
The two latter are the same as for Global stats, except that they show the distribution and the raw stats of the
metrics computed for each window.
Evolution graph
The evolution graph shows the evolution of the metrics computed for each window.
It shows you the window.
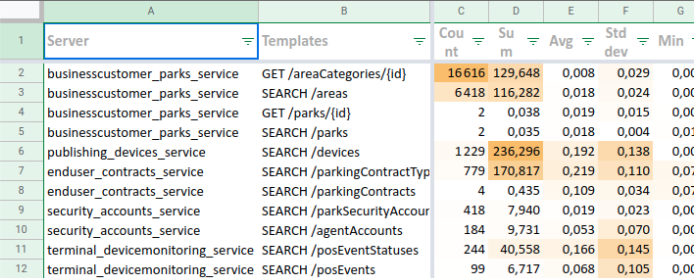
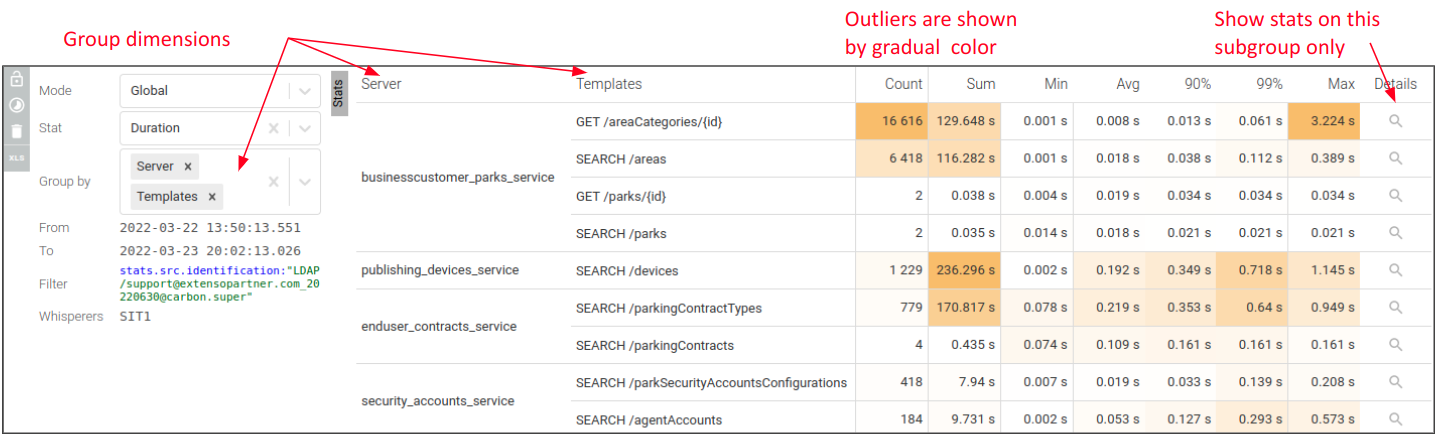
Pivot tables
Statistics may be grouped by a set of dimensions:
- client
- server...
You may stack up dimensions.
It allows, in a couple of clicks, to get and export performance metrics. The color scale applied for each statistic allows also to search for outliers.
Export stats
You may export any stat, included pivots to Excel.
Excel exports include:
- Header with parameters and selection
- Tables & graphics
They are ready to use out of the box
- Autofilter
- Metrics formatting
- Frozen panes
Stat export
Pivot export