Time travel
Time travelling is an essential aspect of finding data.
In too many applications, travelling through time is complex or counter intuitive.
Spider has invested a lot of efforts in making Time travelling a pleasant journey 😉.
Time travel tools allows you to filter the captured data on the time frame you are a looking for.
Spider offers many tools for time navigation:
- Timeline
- Time actions icons
- Free time input
Timeline
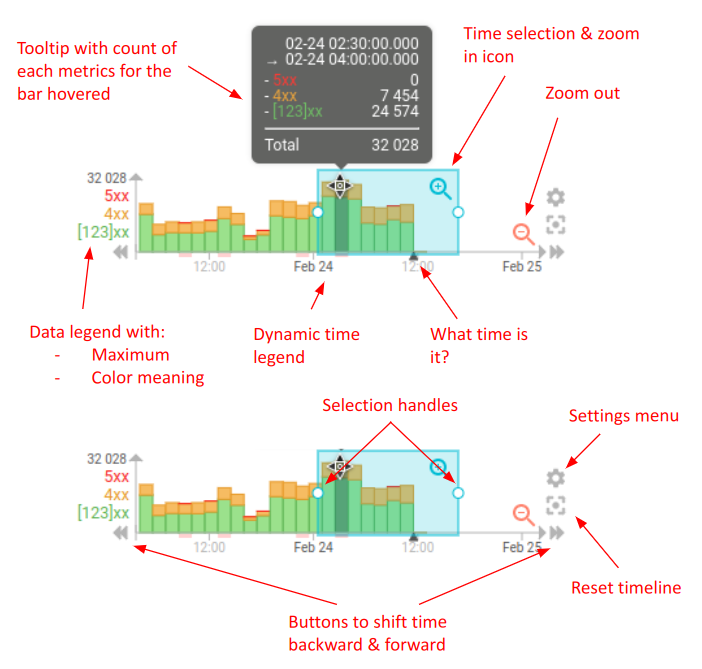
- The timeline is Spider main component to navigate your data
- It shows timed data aggregated over a business dimension and over time
- The data displayed is chosen in the timeline settings menu
- A tooltip shows details about the data when hovering the bars
- The reset button allows getting back to default settings when lost... in time
The timeline has been opensourced to share this great component!
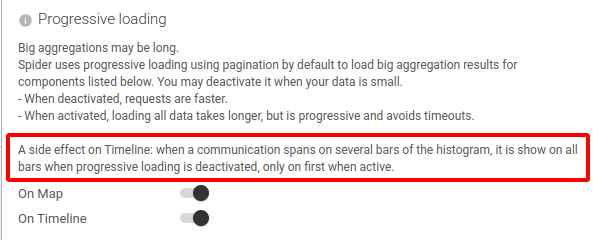
The timeline may display the same item on several bars of the histogram.
Indeed, if the duration is long, the same communication is counted on all bars.
This is true only if progessive loading is not active.
Selecting time
Time selection is made by:
- Click and drag to draw selection
- Anywhere outside selection
- Just below current selection
- Click and drag of the selection handles
- Click and drag of the selection
- Single click on a bar to select just this one
A tooltip shows the selected time when selecting time.
When time selection is outside the visible timeframe, a blue icon allows you to jump back to it
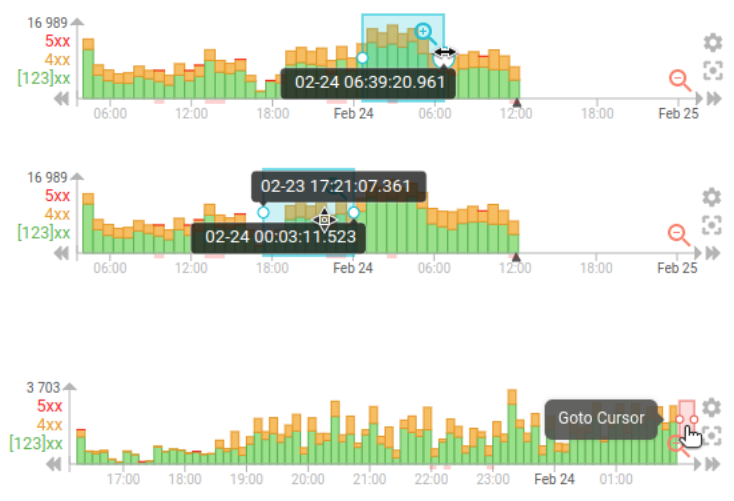
Sliding the visible timeframe
You may change the visible timeframe of the timeline by:
- Clicking on the bottom left
 or right
  icons (slow way)
 - Click and dragging the time selection left or right outside of the timeline
- The further you are, the faster it slides
- Holding
Ctrlkey and dragging the mouse when being over the timeline
Timeline settings menu
You choose what to display on the timeline with the timeline settings dedicated menu.
The options depend on the selected protocol.
The screenshot below is for HTTP.
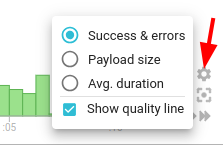
This timeline show Success & errors.
- The legend on the left explains the color code of the selected representation.
- The count on the top left show the maximum value of the graph to give an idea of the scale.

The timeline Y axis is not of big height, and does not show intermediate values.
This is done willingly.
The time is there to show where there are data and to give an idea of the data volume. While still not taking too much height.
Progressive loading
Timeline is loaded progressively by default, using pagination behind the scene.
- Loads smoothly even with massive data
- But prevents showing intervals
You activate progressive loading in Main settings/Dispay tab.
When progressive loading is active, you won't be able to see the duration intervals of communications in the timeline. Only the start time is taken into account.
Progessive
Not progressive
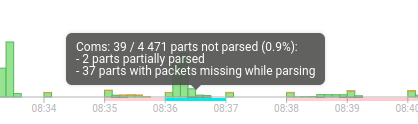
Timeline quality line
The quality line displays, with a 1 min max resolution, the quality of the capture and parsing at the related time.
It helps understanding if missing items are because of Spider or because of the software under monitoring
Qualityline content
The QualityLine may show two different sources of errors:
-
Capture statusis present on all view- Pcap drop - when pcap buffer is too small
- Kernel drop - when kernel is overloaded
- Spider backoff - when Spider server is not scaled enough
-
Parsing statusonly on HTTP view- Parts partially parsed
- Not parsed because of missing packets
Quality issues��
When you have a parsing quality issue, it might be due to:
- An issue with the environment being captured: kernel too old
- An issue with load: the Whisperer cannot capture all packets. You either need to tune it, or to increase the count of whisperers
- An issue with parsing
The later could be because of some bugs left on Spider (possible).
But they can also be due to your software.
for instance we have noticed that (old versions of) PHP Symfony framework were not respecting HTTP standard when using HTTP 100 continue feature.
Spider is not able to parse those mis-communications.
Slow loading
When timeline is too slow to load, an information message tells the user to zoom in time or refine filters.

The slowTimelineMessage threshold parameters to display this message are set in networkview configuration, and may be overridden as any parameters in the Helm values using extraConfiguration directive.
Time actions
Next to the timeline are time actions icons.
Time actions
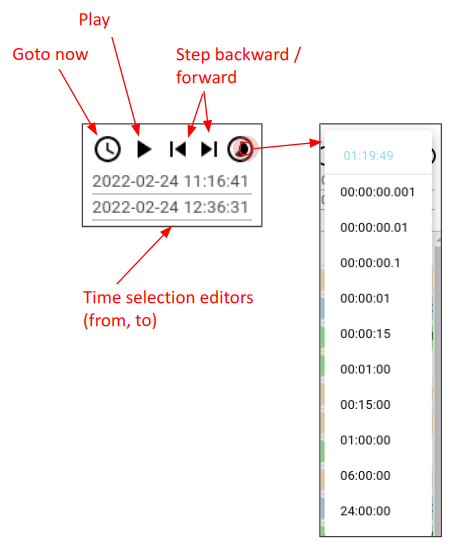
Time actions icons allow you a more precise way - but slower - to move through time:
- Goto now - Centers selection on now
- Play - On small time selection, allows automatic progress in time, every 2s
- Step backward / forward - Move time selection one step. Useful to keep precise limits (like midnight)
- Time span - Offers to select a predefined time span duration
These tools are useful when you want to compare precise durations, like in order to do and compare statistics:
- Select a defined duration, like 1 hour
- Use step forward / backward to move to the following hour, and the next one
Free time input
Free time input allows you to edit time selection to move fast or to a precise point.
These editors have a specific linked behavior with small validation icons:

Input
When typing the date or time, only expected characters are authorized:
[0-9]-- As well as
Cursor movement,EnterandEscape
On top of this, typing is in overwrite mode.
It might seem counterintuitive first, but the goal is both speed and error control.
👉 To use it in the most efficient way, put you cursor before the digit(s) you want to change, and type the new one.
Validation
- You may validate a change of only one input by pressing enter (when no error)
- You may validate a change of both input at once with the validation button
- This allows moving far and fast in time by changing both inputs, and validate only when finished.
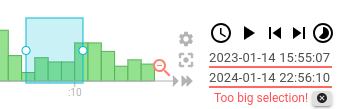
Errors
- When there is an error, the error text shows up with the possibility to cancel the change.
- When start if after end

- When a date is invalid

- When the selection is too big
- When start if after end