Listing deployed agents with a Controller
Controllers are listing Spider agents deployed in the (remote) cluster.
Namespace whitelist and blacklist from Controller infrastructure configuration also apply to these lists.
You may keep some namespace hidden... Or deploy a different Controller for different namespace(s).
Attachments tab
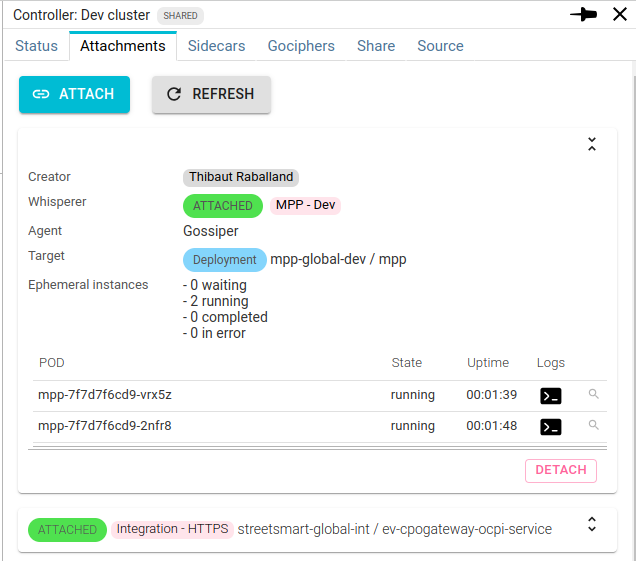
The attachment tab lists all attachments configured for this Controller.

Attachments are collapsed by default, click on the title to expand them.
You know:
- Who created the attachment
- Its status
- On what Whisperer
- What Agent (Gossiper or Whisperer)
- Its target
- The count and list of current Whisperers instances deployed, if any
You can:
- Create another attachment
- Detach an existing attachment
- Refresh the tab
List of instances
The list of instances lists the deployed Whisperers for each attachment.
You have access to:
- The POD name
- The Whisperer state
waitingrunningterminated
- The Whisperer uptime, with a tooltip containing
- Its started date
- The reason for its status - for
waitingandterminatedstatuses - And for
terminatedstatuses- Its finished date
- The errorCode
- The detailed message
You may also:
- Access the last 100 log events from the Whisperer
- Filter on this Whisperer
Sidecars tab
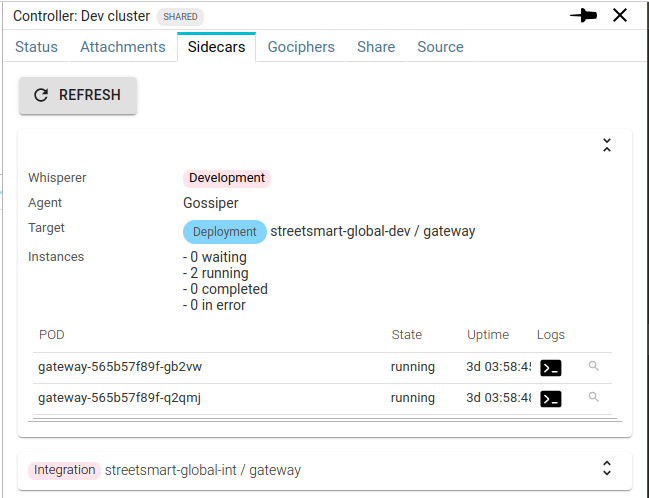
The Sidecars tab lists all Whisperers deployed as Sidecars in the cluster.

Sidecars are collapsed by default, click on the title to expand them.
You know:
- The Whisperer
- What Agent (Gossiper or Whisperer)
- Its target
- The count and list of current Whisperers instances deployed, if any
The list of instances is similar as for the Attachments tab, with the same features.
Gociphers tab
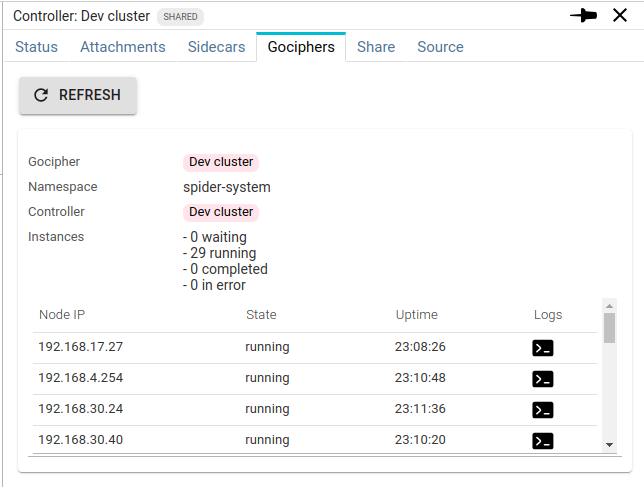
The Gociphers tab lists all Gociphers deployed (as daemonsets) in the cluster.

As there is usually only one Gocipher, there is no collapse feature ;)
You find:
- The Gocipher
- Its namespace
- Its linked Controller
- And the list of its instances. One by node in the cluster.
You may also access the Gociphers logs as for the Whisperers.
Agents logs
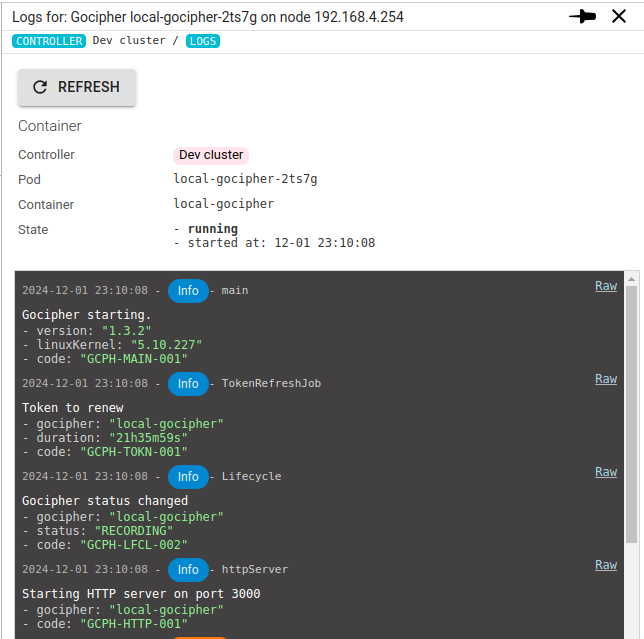
When clicking on the terminal icon, the Controller fetches the last 100 logs of the related agent, and displays them on the UI.
As Spider logs are in JSON, they are formatted nicely, and common fields are grouped at the top.

Should you want complete access to the log item, for troubleshooting, you may open it via the Raw link at the right:

It opens the log as a JSON with color highlighting, folding and search features.