Monitoring a Controller
Spider Monitoring UI has not been updated yet with specific metrics for Controllers.
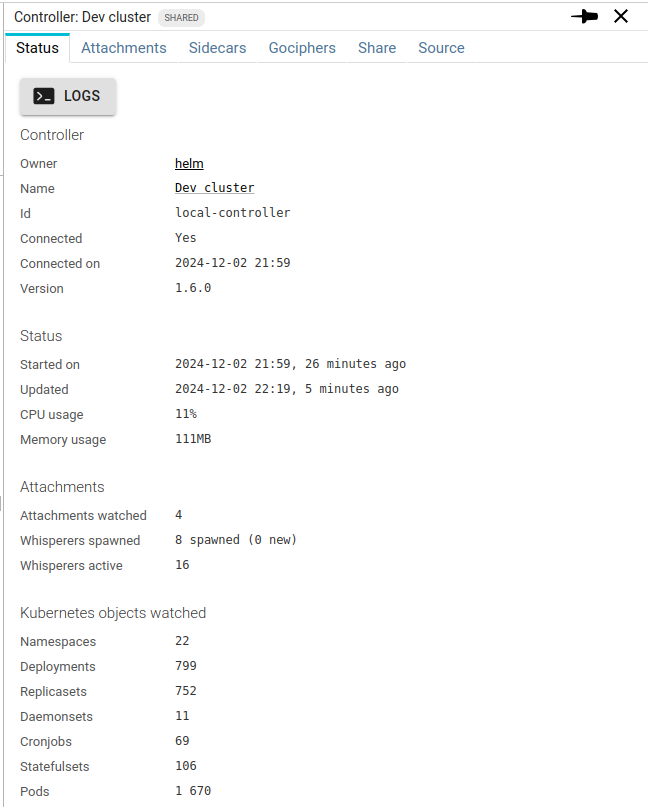
However, current Controller status is brought to the server.
Status tab

You can access there, from top to bottom:
- The Controller version
- Its resource usage (quite low, as usual 😉 )
- The Attachments under its responsibility, and the linked Whisperers spawned
- The count of Kubernetes objects watched by the Controller.
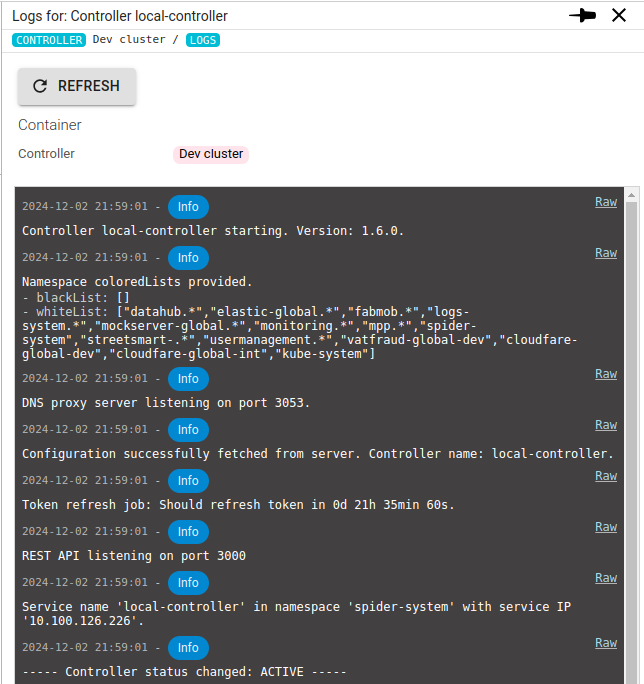
Logs access
You may access the last 100 log events of the Controller from its Status tab.
