Monitoring a Gocipher
As for Whisperer, each Gocipher sends its status to the server at regular interval.
Spider Monitoring UI include a page specific for Gociphers metrics, and a summary in the services map.
The Gocipher details on the analysis UI also shows latest status, aggregated, and for each instance.
Status tab
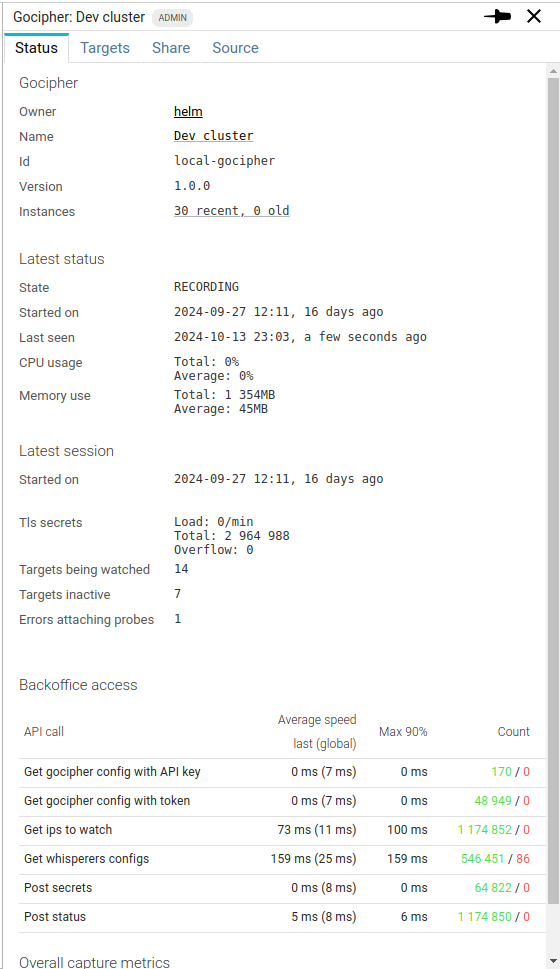
You can access there, from top to bottom:
- The Gocipher version
- The count of instances (one by node in a Kubernetes cluster)
- When it started and for how long it has been running
- Its resource usage (quite low, as usual 😉 )
- The count of Tls secrets it has captured, its current speed and if it has lost some while waiting for the server (overflow)
- The count of targets and if some are:
- Inactive: no OpenSsl library found, or Whisperer no recording
- In error: ...
Targets tab
The targets tab lists all targets requested for this Gocipher to watch.
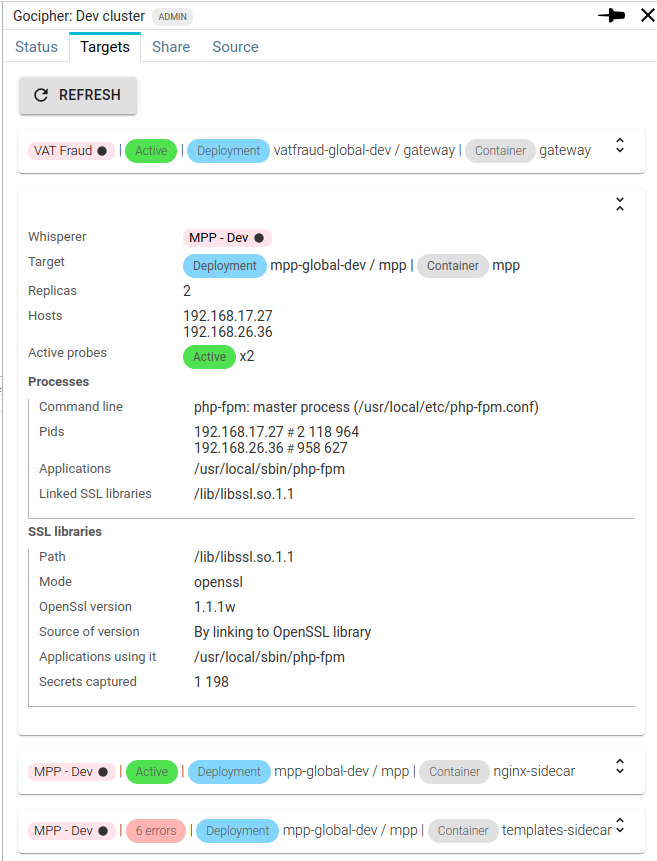
Targets are collapsed by default, click on the title to expand them.
When opening it, you'll find out much information gathered during discovery:
- Main information
- The Whisperer capturing the network with its current status
- The probe status: Active, Inactive and if there are errors
- The container being watched
- How many replicas of the same pod / container are being watched
- On what Hosts (K8s nodes IP addresses)
- How many probes have been attached and their statuses
- The errors if any
- The list of
Processesfound by the discovery process- Command line
- PIDs
- The application executable
- The SSL libraries found
- The
SSL librariesunder capture- Path
- Mode:
opensslornode - OpenSsl version
- How the version was found
- The path of the application binaries using it
- How many secrets where captured since the Uprobe attachment