Testing installation by uploading data
In this walkthrough, you will:_
- Connect to the UI
- Create a Whisperer
- Configure it
- Upload data on this Whisperer
- Check that the data has been parsed correctly
Connect to the UI
- Connect to the endpoint from your Browser of choice.
- Spider is being tested in priority on Chrome, but works on other browsers.
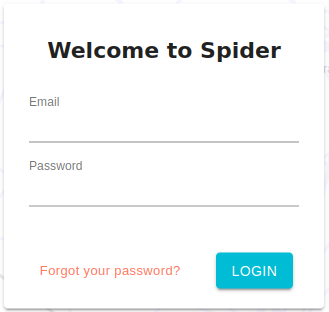
- You will be redirected to the login page.
- Login as your administrator account created at installation
- Depending on your login configuration, used you LDAP account, OIDC account, or reset your password (as it is the first time access).
- The analysis UI opens with the terms and condition to validate.
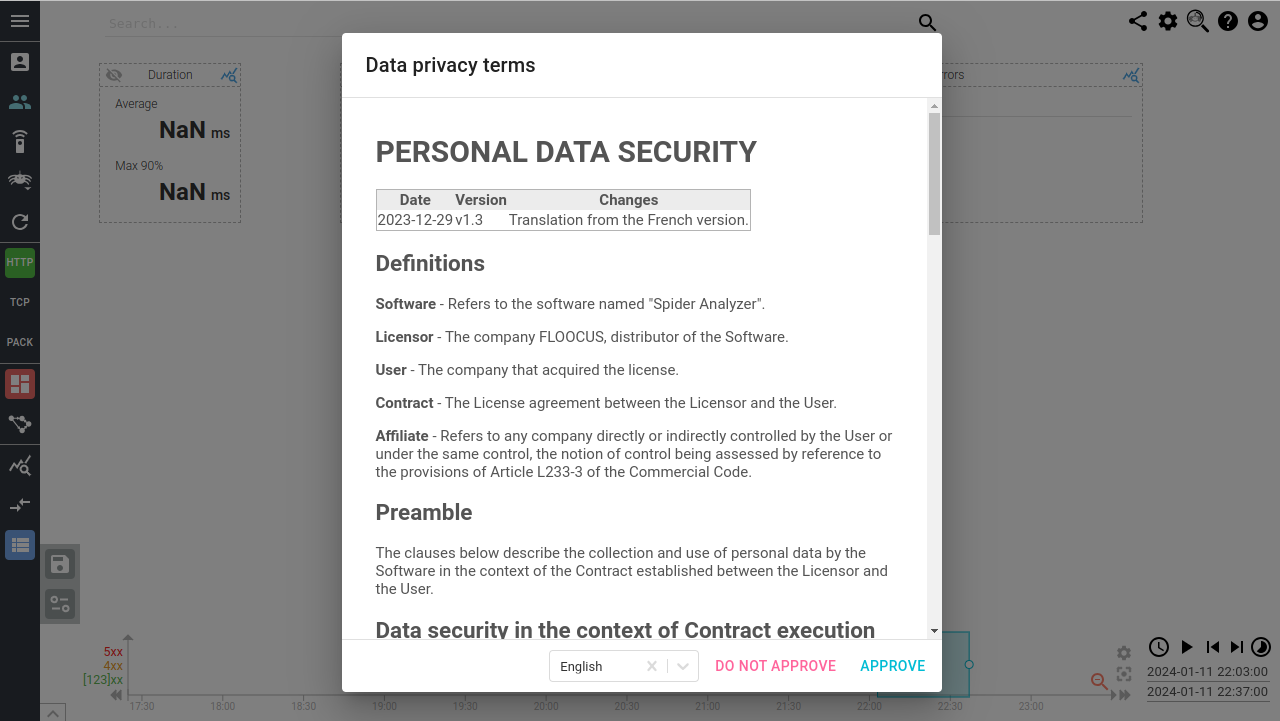
- Accepts the terms (or close the window and change tool 😆)
- The
Welcomescreen shows
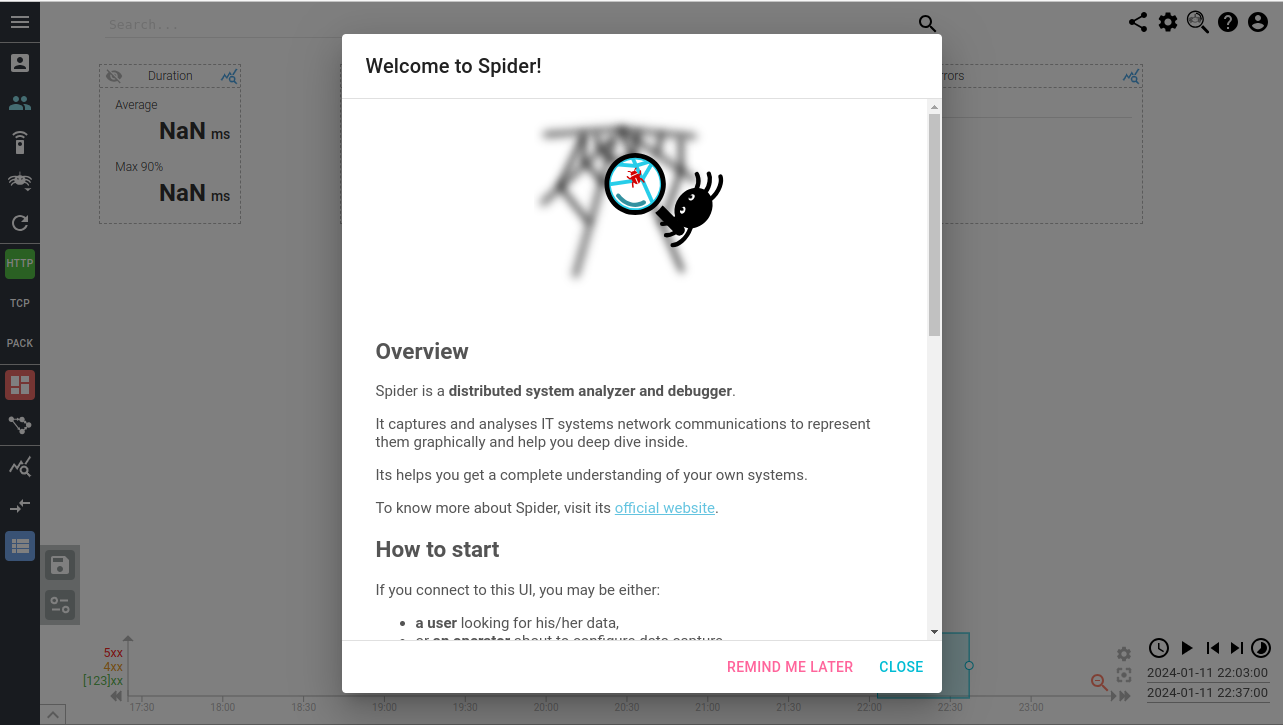
- Click
REMIND ME LATERto be able to review documentation links next time
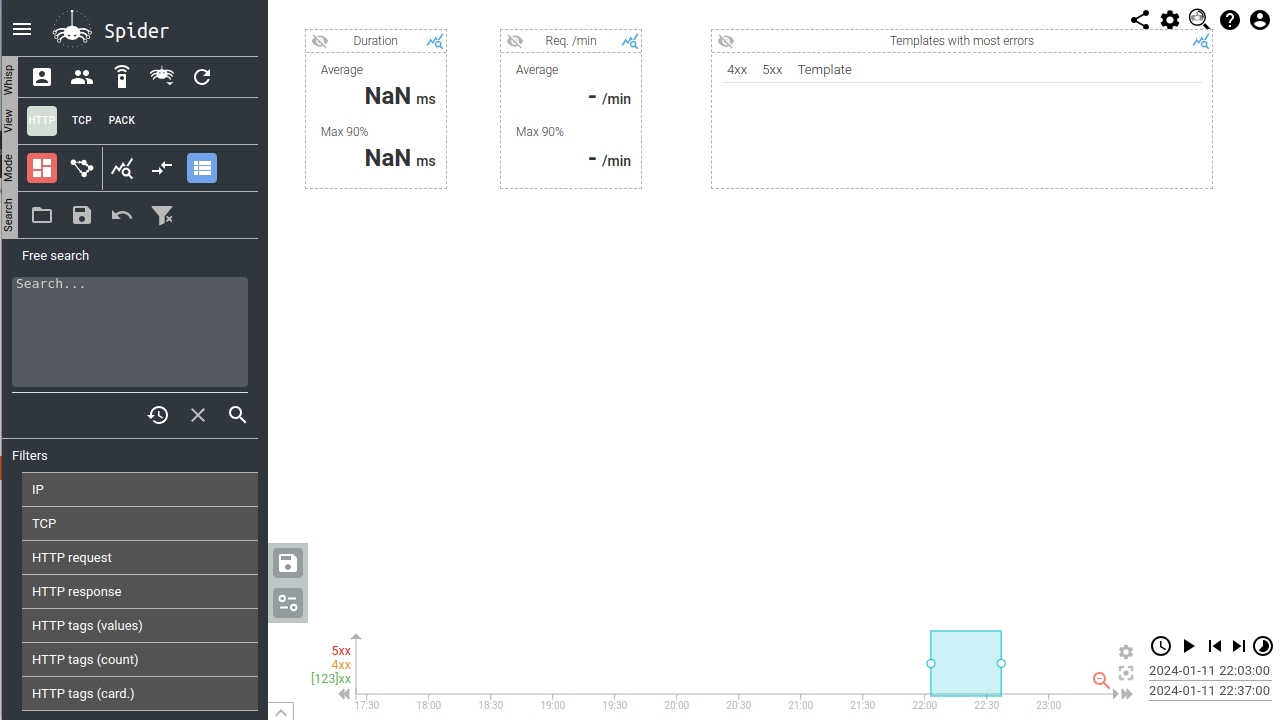
You are now connected as administrator in the Analysis UI.
Create and configure a first Whisperer
You will now create a first Whisperer that will allow you to upload packets data to Spider.
- Open the Whisperers menu
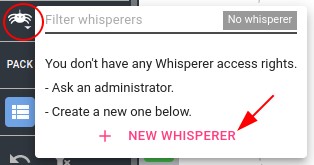
-
Click on the
+ NEW WHISPERERbutton to create a new Whisperer- The Create Whisperer form opens with default settings.
-
Edit the configuration to match the screenshot below
- Adjust the name to your liking 😉
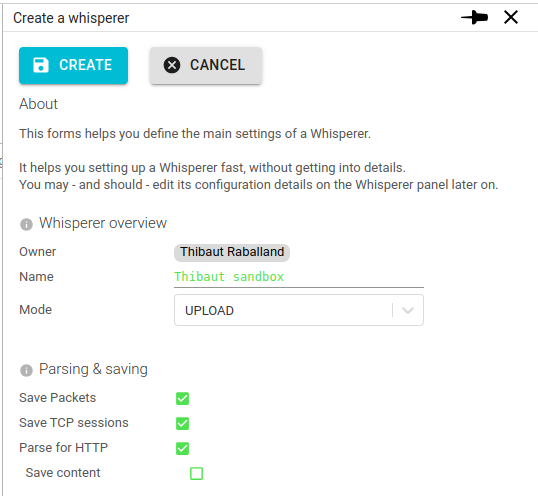
- Click
CREATE- The Whisperer details panel open. You may close it.
This is quite enough to start testing!
Upload data
Now you will select your Whisperer, upload a pcap capture data file, and see the communications get created.
- Open the Whisperers menu
- Select the newly created Whisperer. Here:
Thibaut sandbox

A round button appears at the top left of the screen, outside the menu with an upload icon.

- Download this pcap file SpiderLogin.pcap locally
- Click on the
Upload buttonand select the previously downloaded file
A pop-in appears to launch the upload (and parsing) process.
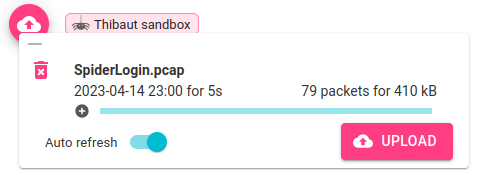
- Click
UPLOAD
The progress bar shows the progressive sending of packets to Spider.
When it is over, click on the focus icon.
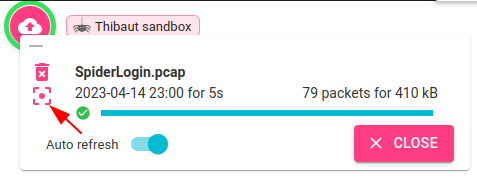
The timeline is centered around the date of capture.
The map is updated, so is the grid.

The data may not be completely accessible yet. A 10s delay is required before parsing starts.
Check data
You may now browse the data.
- Click on the record
/NetworkMapT.pngin the grid.
It opens on the right with the diagram below.
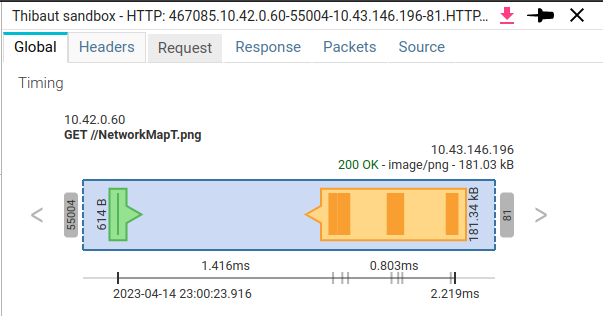
Fine! :)
- You may also click on the response tab to see the content.
The picture of the login page is shown.
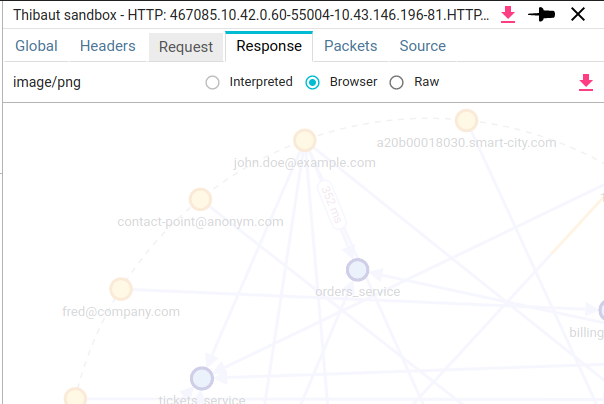
Congratulations!
You've successfully uploaded your first capture and have a working Spider!