Bottom Panel
The bottom panel is used to display the filtered captured data in various ways:
- Grid: Shows unitary communications one by one, in a grid.
- Sequence diagram: Shows unitary communications in a sequence diagram to reveal parallel processing.
- Stats: Shows aggregated statistics on the captured data.
Grid
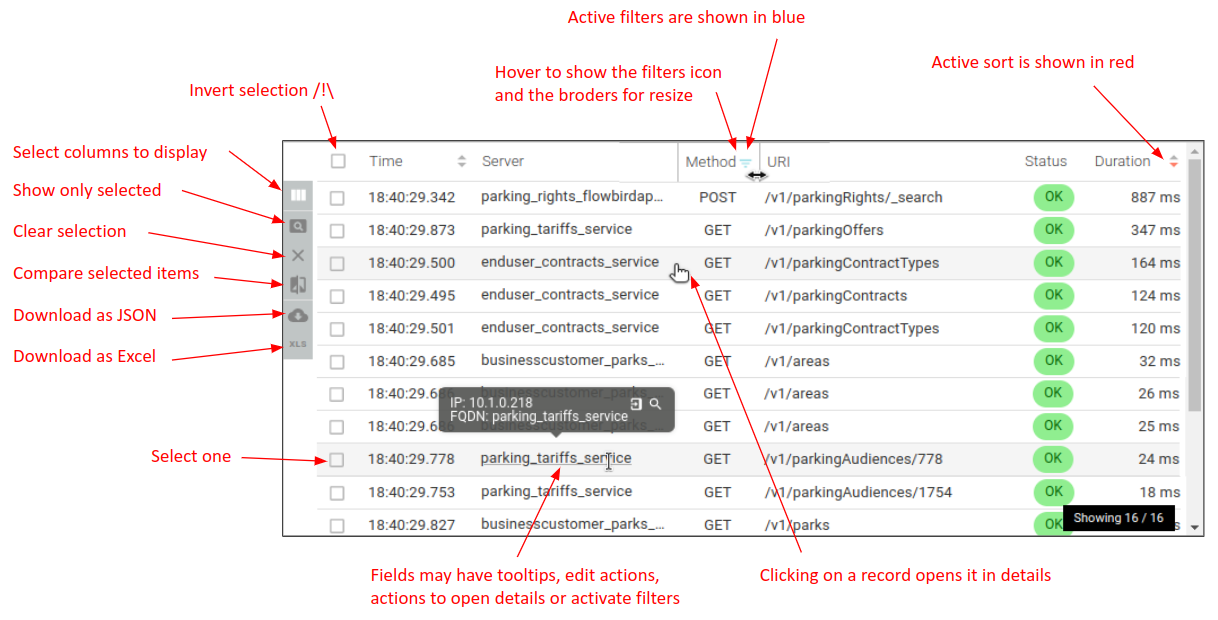
The Grid is a dynamic and customisable grid listing all communications matching your filters. You may:
- Select the data to show
- Resize columns to see better
- Filter & sort on data
- Open unitary communications
- Select and add coms throughout your searches (with memory)
- Compare two or more coms
- Export selected coms in Excel or JSON
The grid uses infinite scroll for pagination
- Advise: Filter rather than scroll down ;-)
Use cases
- Browse records
- Get details of flow
- See many calls to see difference in the grid
- See all calls from a specific filter: request Uri, template, client, error code
- ...
Sequence diagram
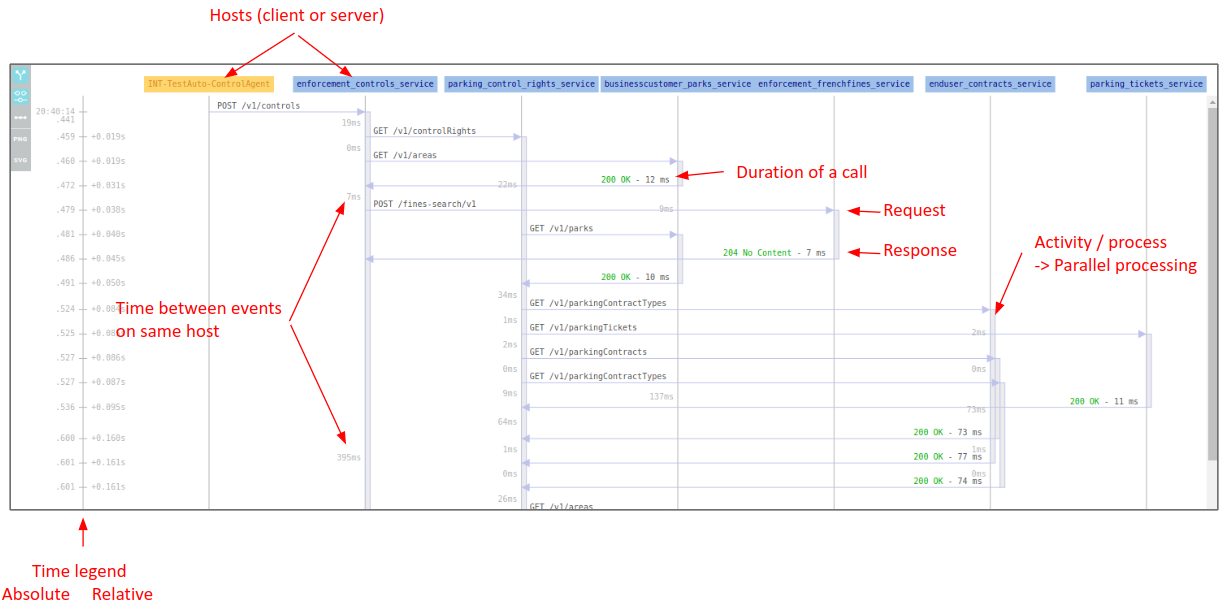
Sometimes, you have a service that calls another one, that then calls another one… This is what is called the fan out. Understanding what calls what in what sequence might be cumbersome.
The sequence diagram displays the sequence of calls and how they interact together:
- Shows the calls sequence
- Shows their hosts and target
- Compute the duration in between
- Guess the computation time.
Use cases
- Understanding
- Optimisation of processing and flow
- Troubleshooting parallel processing
- …
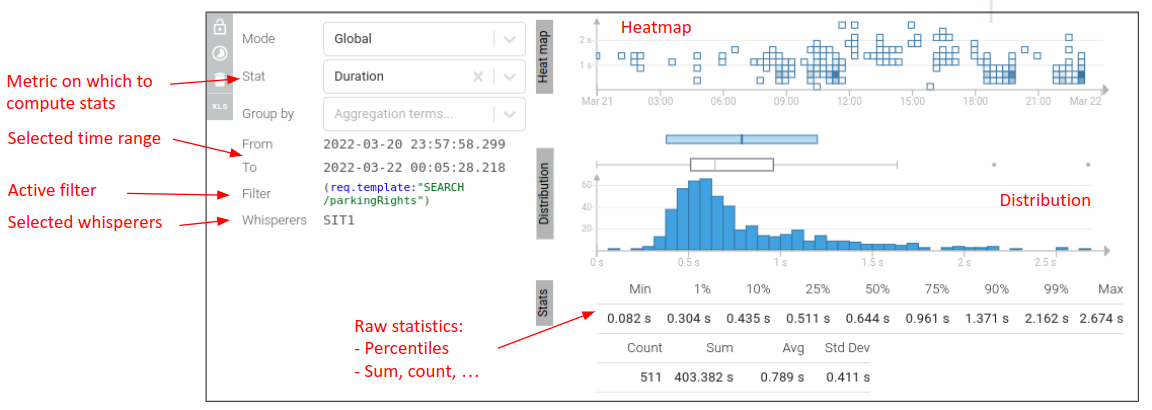
Stats
Spider offers the possibility to perform statistics over a selection of calls.
Statistics depend on:
- Selected whisperer(s)
- Selected filters
- Current time selection
Statistics may be:
- Over the whole set of filtered data or grouped by various dimensions (pivots)
- Computed over the whole time range or by sub time periods.
Details of statistics bar is shown when overing any bar of the charts. CLicking on the bars or cells add automatic filters to focus and find the concerned records in the Grid view.
Each stat may have
- Its parameters locked: all parameters, whisperer and filters are locked
- → Compare stats for various environments, different dataset…
- Its time selection locked
- → Compare stats on different time period Locking both allows to keep stats for the selection, and go digging in parallel.
Stats may also be exported to Excel.
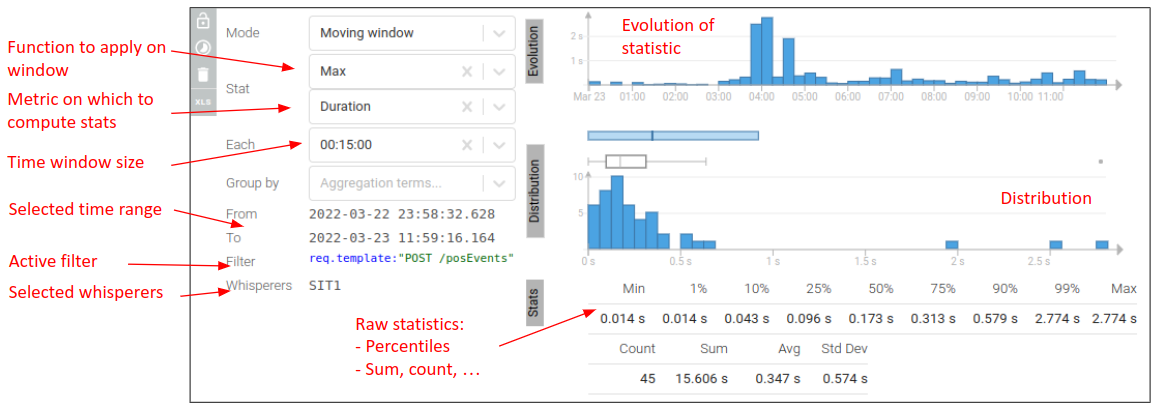
Global stats
Moving window stats
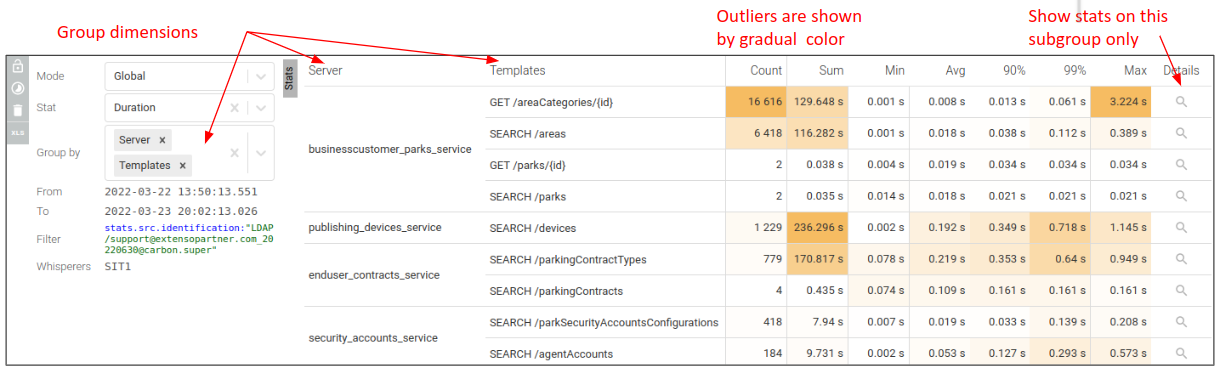
Pivot tables
Use cases
- Performance statistics
- Outliers and usage patterns discovery
- Issue drill down
- ...
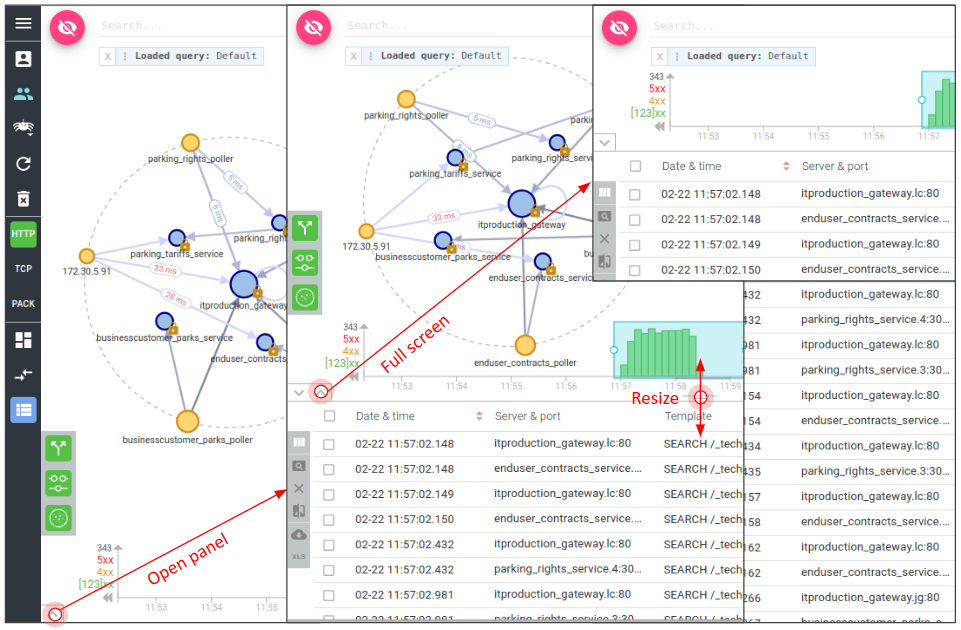
Bottom panel action
The bottom panel may be resized up to full screen.