TCP sessions
Concept
A TCP session is a channel of communication between two parties.
It is a stateful sequence of related packets between a client and a server.
Each TCP packet is associated with:
- Source and destination IP address
- Source and destination TCP port
- SEQ, ACK, WIN, LEN attributes
- Flags (SYN, ACK, PSH, FIN, RST)
Whisperers agents track TCP sessions on the capture side, and associate to the packets:
- TCP session id
- Direction
- Index in session
- Relative SEQ & ACK
The TCP sessions are sent to the Spider backend and are used as the envelope for high level parsing.
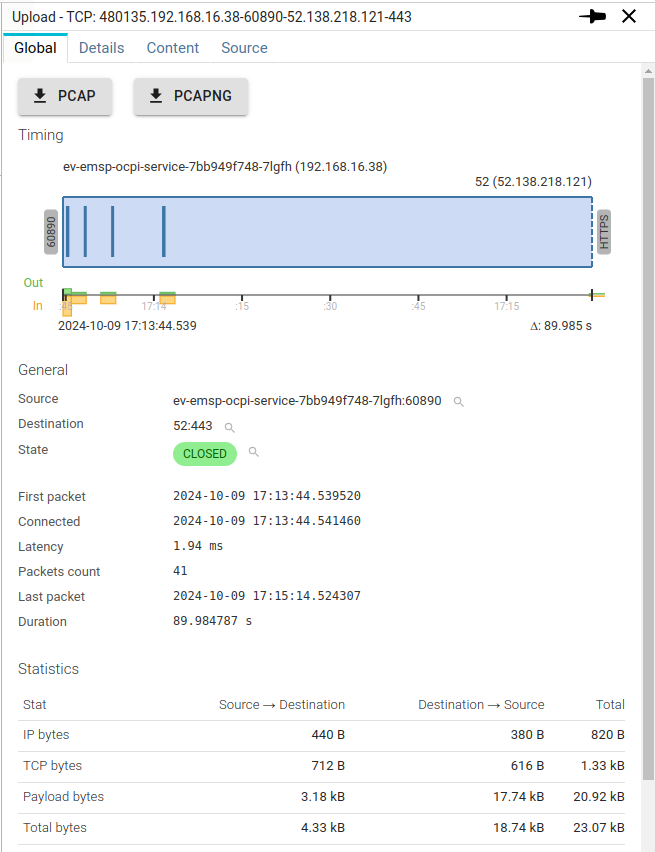
Global tab
Each ![]() icon in the details shows a prebuilt filter.
icon in the details shows a prebuilt filter.
Clicking on it adds a filter in the selected filter.
Actions
Buttons offers to download the TCP session either as a PCAP file, or as a PCAP-NG file.
PCAPfiles includes only raw packets data and timestamps in this classic format from tcpdump tool.PCAP-NGfiles includes those same packets but also:- Source and Destination hostnames for Host resolution when later opening in Wireshark or Spider
- TLS secrets for TLS deciphering when later opening in Wireshark or Spider
These files may then be opened in many tools like Wireshark.
It may even be uploaded back to Spider 😉
Pcap-Ng specific fields
On top of Packets, Name resolution and TLS secrets, Spider also stores some non-standard fields in Pcap-Ng format to be able to reprocess the session fluently when uploading back.
These fields are stored together with the TLS secrets of the session:
| Field | Value example | Description | Corresponding field in TLS key of Tcp session |
|---|---|---|---|
TLS_VERSION | TLS 1.2 | Version of TLS used | tlsVersion |
CIPHER_NAME | TLS_AES_256_GCM_SHA384 | Cipher standard name used to encrypt the data | cipher.name |
CLIENT_ENCRYPT_THEN_MAC | true | Tells if EtM mode is active for this Cipher on text sent by the client | serverEncryptThenMac |
SERVER_ENCRYPT_THEN_MAC | false | Tells if EtM mode is active for this Cipher on text sent by the server | serverEncryptThenMac |
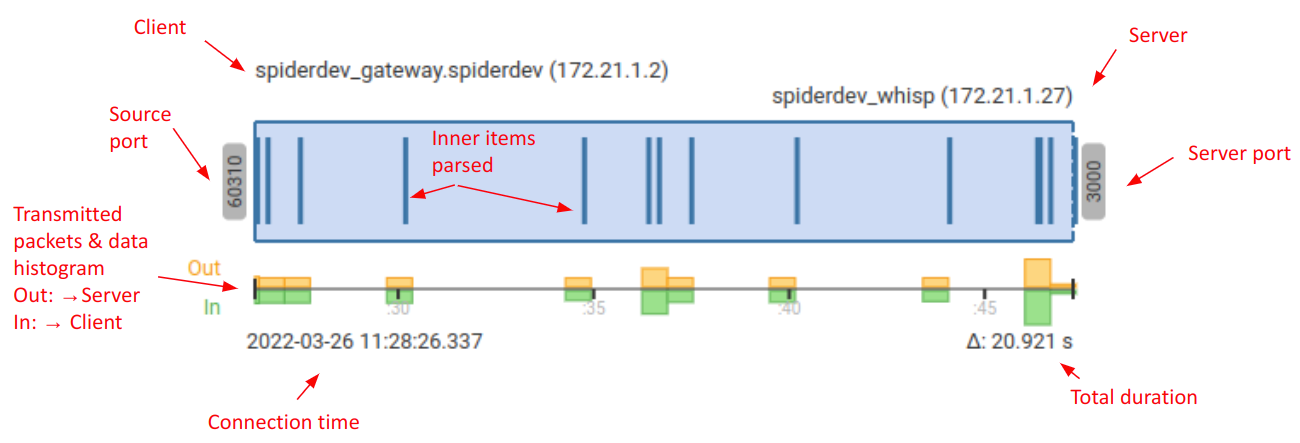
Timing
The timing diagram shows much information at a glance:
General
The General section shows identification information:
| Field | Description |
|---|---|
| Source | The client host and port |
| Destination | The server host and port |
| State | State of the session: SYN_SENT → SYN_RECEIVED → ESTABLISHED → CLOSE_WAIT → LAST_ACK → CLOSED |
| First packet | First packet date |
| Connected | Second SYN packet date (if captured) |
| Latency | Delay between First packet and Connection time |
| Last packet | Last packet captured date |
| Duration | Delay between First and Last packets |
| Missed syn | Tells if the Whisperer captured the SYN exchange (connection establishment) |
TLS encryption
Shows TLS version and Cipher used when the TCP session iss encrypted in TLS.
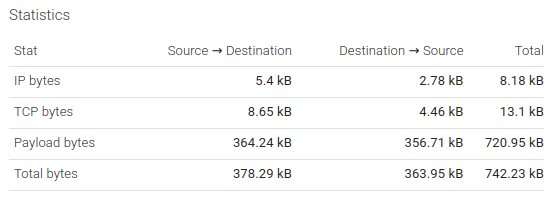
Statistics
The Statistics section shows statistics on the data exchanged volume.
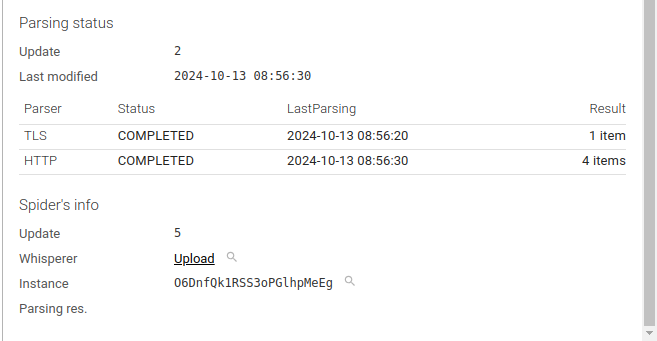
Spider info
This section shows Spider own information:
- Whisperer
- Whisperer instance
You may also see the Parsing res. link when you've set Spider to save it in the Whisperer settings.
In this case, you would also have another tab displaying this one (as raw JSON).
This is mostly for debugging Spider itself.
Details tab
The Details tab shows again the Tcp session timing.
Associated with the packets flow.
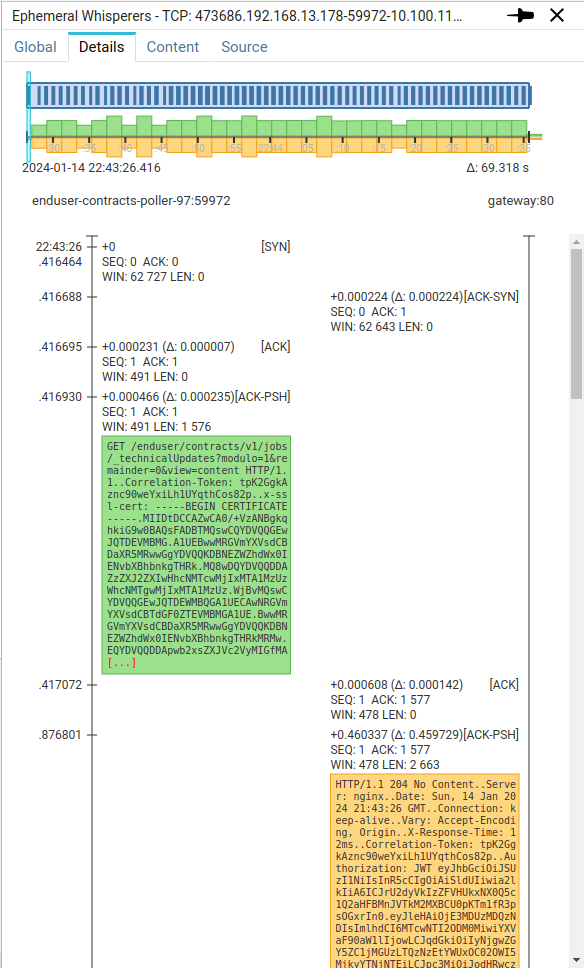
A light blue cursor shows the timeframe represented on the packets sequence flow below. The cursor features a handle on the left that allows to move it to jump to any specific time inside the Tcp session.
The second diagram represents the packets flow:
- On the left, the client packets
- On the right, the server packets
- The left axis shows the time
- In absolute, left to the axis
- In relative, right to the axis
- With the delta since last packet, in parenthesis.
- The main TCP flags of each packet are shown as headers above the packets.
- And the first packets bytes are presented in ASCII.
- You might click on any packet header to open thi packet in the details panel
When you scroll down,
- next packets are loaded progressively,
- the blue cursor move on the timing diagram.
The view is great to debug Tcp sessions!
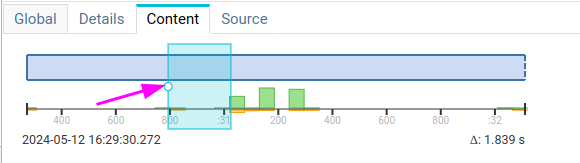
Content tab
The Content tab shows the flow of packets, aggregated together as Spider would rebuild its packetLots.
A packetLot is a group of consecutive TCP packets with data in the same direction (request or response).
It is similar to what you would have with Wireshark 'Follow Tcp flow' feature.
It offers rich features:
- The same Tcp session timing diagram as for the two previous tabs.
- You may jump through time by moving the cursor
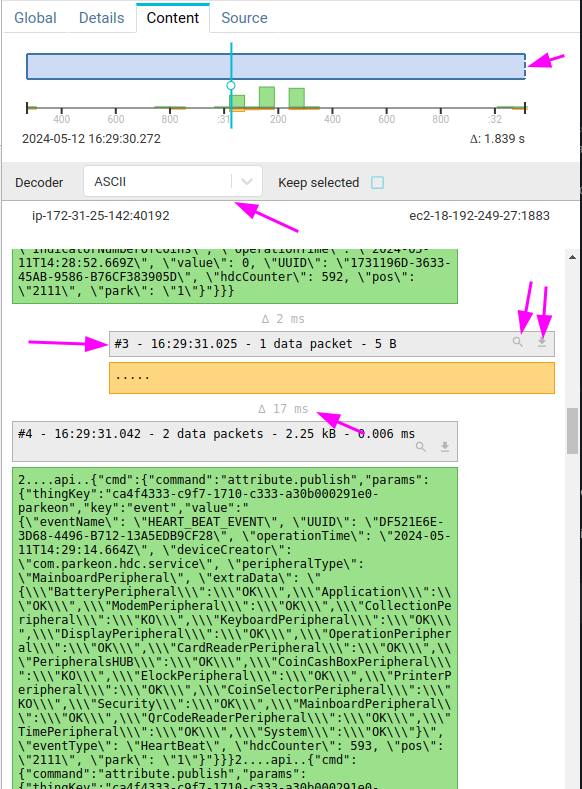
- The content may be decoded by plugins
- The option
Keep selectedallows to keep the decoder active when selecting other TCP sessions
- The option
- The content is progressively while you're scrolling down.
- It displays duration between each PacketLot
- It displays PacketLot header on top of PacketLot with
- Its number
- The time of the first packet
- How many packets are involved
- The total TCP payload size
- The duration between first and last packet of the PacketLot
The header:
- Allows downloading only one PacketLot as PCAP
- Allows showing the packets of a specific PacketLot in Packets grid
Also:
- You won't notice packets overlapping or in disorder since Spider will manage it and rearrange and merge the packets.
- Packets arriving too late are shown with a red background. For instance, when a request packet arrives after the response started.
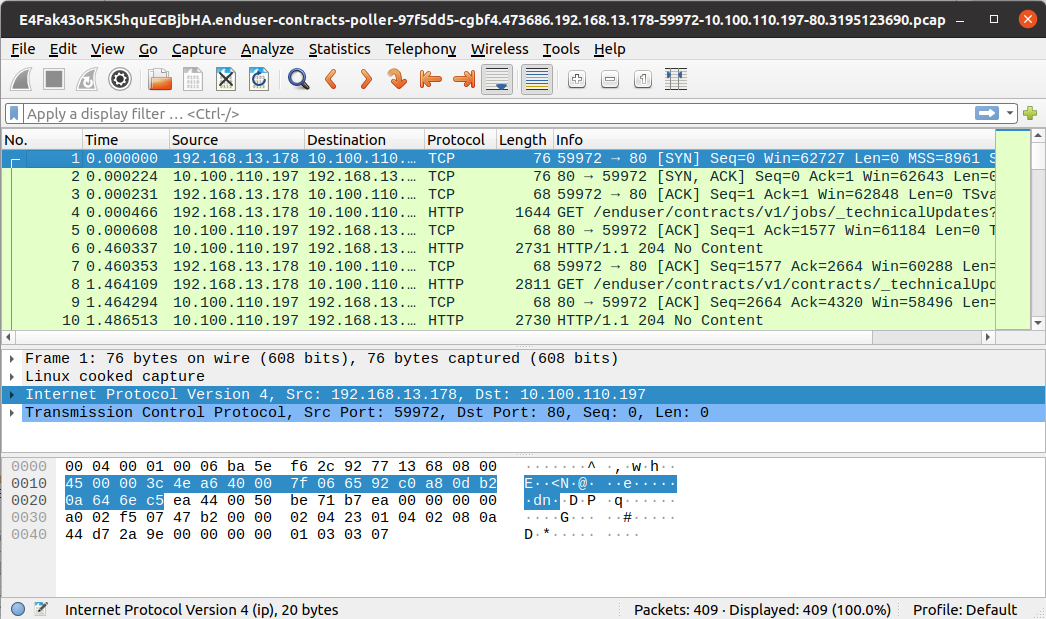
Source tab
The Source tab shows the Tcp session in JSON format.
Below is a sample Tcp session as it is available through the API:
{
    "@id": "E4Fak43oR5K5hquEGBjbHA.enduser-contracts-poller-97f5dd5-cgbf4.473686.192.168.13.178-59972-10.100.110.197-80.3195123690",
    "@type": "TcpSession",
    "version": "2.0",
    "name": "473686.192.168.13.178-59972-10.100.110.197-80",
    "whisperer": "E4Fak43oR5K5hquEGBjbHA",
    "instanceId": "enduser-contracts-poller-97f5dd5-cgbf4",
    "src": {
        "ip": "192.168.13.178",
        "port": 59972,
        "name": "enduser-contracts-poller-97f5dd5-cgbf4",
        "socket": "192.168.13.178:59972"
    },
    "dst": {
        "ip": "10.100.110.197",
        "port": 80,
        "name": "gateway.streetsmart-global-dev.svc.cluster.local",
        "socket": "10.100.110.197:80"
    },
    "state": "ESTABLISHED",
    "packetsCount": 409,
    "lastPacketToParse": 407,
    "syn": 1705268606.416464,
    "missedSyn": false,
    "connect": 1705268606.416688,
    "first": 1705268606.416464,
    "firstDate": "2024-01-14T21:43:26.416Z",
    "firstMinute": "2024-01-14T21:43:00.000Z",
    "last": 1705268675.734102,
    "lastDate": "2024-01-14T21:44:35.734Z",
    "lastMinute": "2024-01-14T21:44:00.000Z",
    "duration": 69.317638,
    "latency": 0.000224,
    "synchro": 1705268676.281,
    "out": {
        "initialSeq": 3195123690,
        "ip": 5400,
        "tcp": 8648,
        "payload": 364239,
        "lastAck": 383439644
    },
    "in": {
        "initialSeq": 383085594,
        "ip": 2780,
        "tcp": 4456,
        "payload": 356711,
        "lastAck": 3195487930
    },
    "currentPacketLot": 267,
    "lastDataDirection": "in",
    "parsers": {
        "http": {
            "status": "PARSED",
            "lastParsing": "2024-01-14T21:44:43.710Z",
            "itemsCount": 134,
            "httpPers": "E4Fak43oR5K5hquEGBjbHA.enduser-contracts-poller-97f5dd5-cgbf4.473686.192.168.13.178-59972-10.100.110.197-80.3195123690.HttpParsingLog",
            "lastPacketLotComplete": 267,
            "lastPacketParsedIndex": 407
        }
    },
    "timespan": {
        "gte": "2024-01-14T21:43:26.416Z",
        "lte": "2024-01-14T21:44:35.734Z"
    },
    "dateCreated": "2024-01-14T21:43:27.436Z",
    "dateModified": "2024-01-14T21:44:43.722Z",
    "_eTag": "\"8f-BiOdhYIWeBh8+U+QoMFZ4C/OazE\"",
    "_maxPacketsToParse": 409,
    "_update": 3525
}
Most fields are self-explanatory. Most fields are indexed and searchable.
Some extra explanation:
| Field | Description |
|---|---|
| state | State of the session: SYN_SENT → SYN_RECEIVED → ESTABLISHED → CLOSE_WAIT → LAST_ACK → CLOSED |
| latency | Delay between First packet and Connection time |
| duration | Delay between First and Last packets |
| syn | First SYN packet timestamp (when we got it) |
| connect | Second SYN packet timestamp |
| first | First packet timestamp (may be any when the Whisperer does not capture the SYN) |
| synchro | Timestamp the last packet was captured |
| in/out | Size of data in each layer + initial SEQ number & last ACK number |
| currentPacketLot | Count of packetLots captured from the Whisperer |
| lastDataDirection | Last direction seen from the Whisperer |
| dateCreated | Date the Tcp session got created in the backend |
| parsers | Status of parsers (only HTTP for now) |
| timespan | Range of duration of the session, for range queries |
| _update | Internal tracking number |