Monitoring a Whisperer
The Self Monitoring UI includes a full tab to monitor Whisperer: Whisperers Status.
But monitoring information is also brought up to the Analysis UI.
- The Whisperer
Statustab allows to see in a glance the current status of the Whisperer, as well as key metrics. - The
Attachmentstab lists all workload on which this Whisperer is attached by Controllers. - The
TLStab lists all targets watched by Gociphers linked to this Whisperer. - The
Hoststab lists all captured hosts.
Status page
Identification
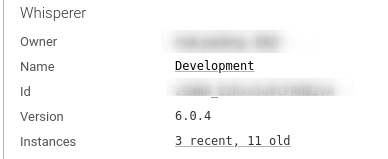
| Field | Description |
|---|---|
| Owner | User or Team who created the Whisperer |
| Name | Whisperer name |
| Id | Internal id (random) |
| Version | Version of the Whisperer instance(s) deployed. May show several. |
| Capture method | What capture method is used by the Whisperer. |
| Instances | Link to the status page of each current instances and latest ones. |
Instances status page
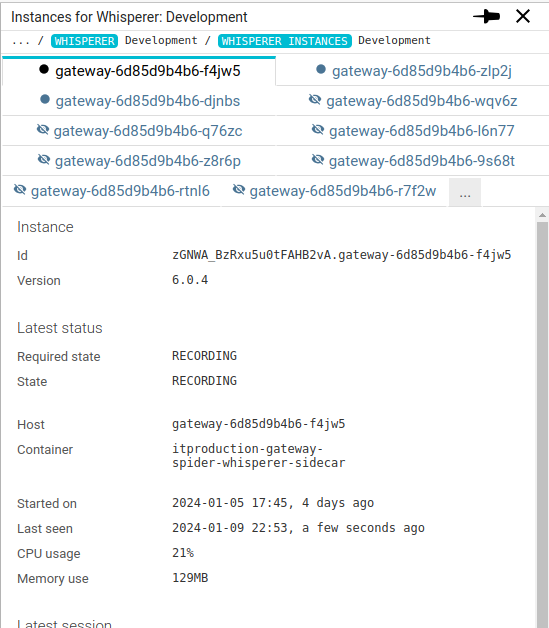
Latest status
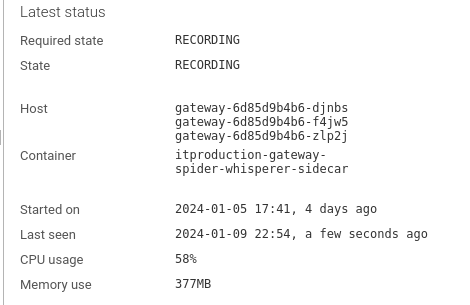
| Field | Description |
|---|---|
| Required state | As specified in configuration |
| State | Last known state of the Whisperer |
| Host | Hostname / POD name of the Host under capture |
| Container | Name of Whisperer container |
| Started on | When Whisperer session last started (last time when no instances were started / recording or stopped) |
| Last seen | Last status update of an instance |
| CPU usage | Sum of CPU usage of all instances |
| Memory use | Sum of RAM usage of all instances |
Latest session
Shows information on latest recording session.
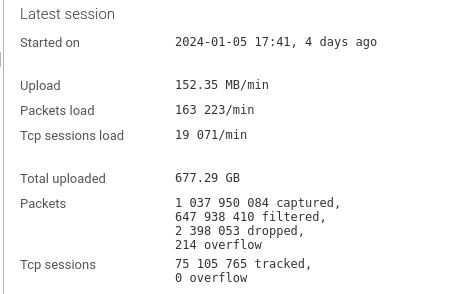
| Field | Description |
|---|---|
| Started on | Last time Whisperer started recording |
| Upload | Upload speed in last 20s |
| Packets load | Packets parsing load in last 20s |
| Tcp session load | TCP sessions tracking load in last 20s |
| Total uploaded | Total volume uploaded |
| Packets | Count of packets:
|
| Tcp sessions | Count of sessions tracked and overflow. |
Backoffice access
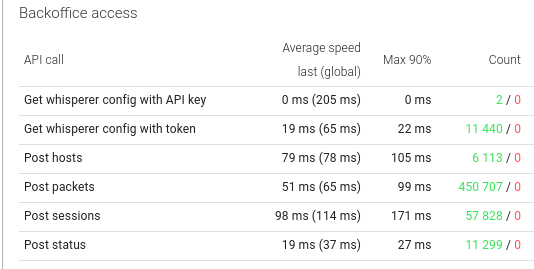
Gives statistics on the quality of communication between the Whisperer and Spider backend.
For each API called:
- The average response time for last 20ms, and globally since the session start
- The 90 percentile of response time for last 20ms
- The count of calls
- In success - green
- In error - red
Overall capture settings

Gives cumulated statistics since the creation of the Whisperer...
Big numbers!
Attachments tab
The attachment tab lists all attachments configured for this Whisperer.
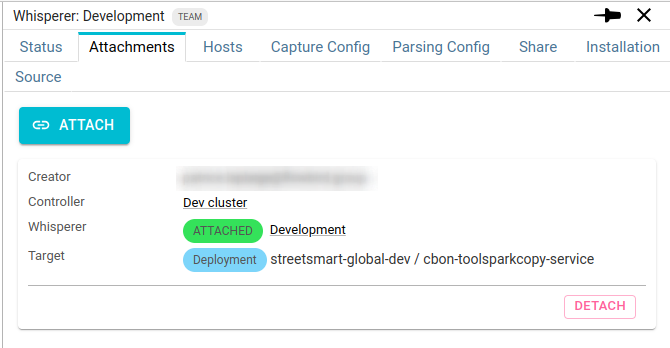
You know:
- Who created the attachment
- On what Controller
- Its status
- Its target
- The list of current containers observed, if any
You can:
- Create another attachment
- Detach an existing attachment
TLS tab
This tab lists all targets watched by Gociphers linked to this Whisperer.
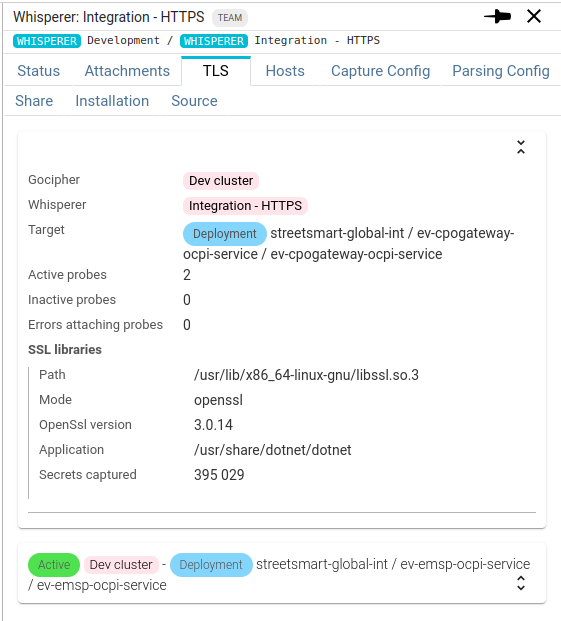
Targets are collapsed by default, click on the title to expand them.
You know:
- the Gocipher capturing the TLS secrets
- The Whisperer capturing the network
- The Target. Above, the containers being watched:
[Workload kind] Namespace / Pod name / Container name. - How many probes have been attached - linked to how many replicas.
- The errors if there are.
- The SSL libraries discovered:
- Path
- Mode:
opensslornode - OpenSsl version
- The path of the application binary, here:
.Net - How many secrets where captured since the Uprobe attachment
Hosts tab
On the Hosts tab of the Whisperer details, you may access to all Hosts records captured, uploaded or manually set for this Whisperer.
If you select many Whisperers, you will see a combination of all Hosts records.
These are the records used to display the host names on the UI.
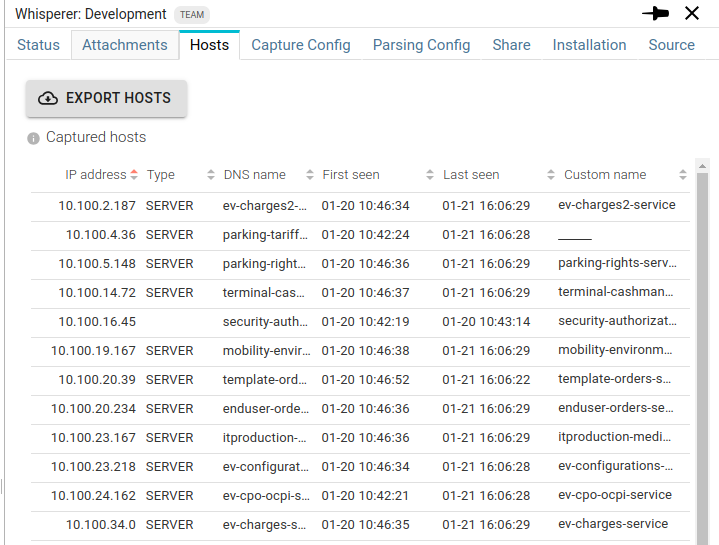
| Column | Description |
|---|---|
| IP address | IP of the host |
| Type | SERVER, CLIENT or BOTH (empty) |
| DNS name | FQDN as resolved by the DNS |
| First seen | Time it was first seen |
| Last seen | Time it was last seen |
| Custom name | Custom name, either set by the Whisperer as parsing time or set manually on the UI |
This tab allows you to export the Hosts records to be able to import them back in an UPLOAD Whisperer.
You may set the Custom name of any Host directly from this tab, by setting it in the Custom name column.